Download
1 / 18
180 likes | 285 Vues
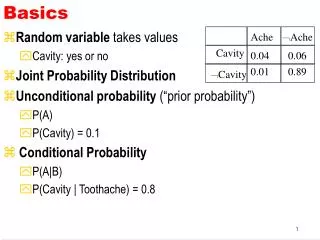
SCIAMCHY monitoring concept (basics) and results. J. Frerick, EOP-PVP. Layout. Motivation What could we learn from SCIAMACHY? Short tour through the SCIAMACHY instrument Commonalities Differences SCIAMACHY science channels SCIAMACHY PMD channels Monitoring concept Monitoring results

E N D
SCIAMCHY monitoring concept (basics) and results J. Frerick, EOP-PVP
Layout • Motivation • What could we learn from SCIAMACHY? • Short tour through the SCIAMACHY instrument • Commonalities • Differences • SCIAMACHY science channels • SCIAMACHY PMD channels • Monitoring concept • Monitoring results • Ch1 average Signal vs time • Ch2 average Signal & PMD A vs time • Ch1 vs time (per pixel) • Ch2 vs time (per pixel) • Ch8 – an example for water ice • Summary • Acknowledgements/Link to useful web pages
MotivationWhat could we learn from SCIAMACHY? • It is a similar type of instrument • One might expect similar problems • In deed, those channels, both sensors have in common (GOME-II cover SCIAMACHY channels 1 to 4) degrade. • But as probably known to everybody, the degradation rates are different, which puts the question, whether their origin is the same. • SCIAMACHY also has got IR channels, which show a very different behaviour in terms of degradation, compared to the UV-VIS ones • Since SCIAMACHY explains IR behaviour with the presence of water ice, some of the typical IR results will be shown here, too, since there might be found communalities between GOME-II UV-VIS degradation and SCIAMACHY IR one. • However, this presentation is aiming to explain the situation in SCIAMACHY rather then concluding, what might be the case in GOME-II
Short tour through SCIAMACHY InstrumentCommonalities • Like GOME-II it is a double spectrometer with a pre-disperser prism / channel separator and a grating for each of its 8 channels. • Channel definition see following slides, 1st 4 channels are about the same as for GOME-II • Polarisation measurement are needed, too, but their functionality is reduced compared to GOME-II (see next slide) • Detectors have to be cooled in order to achieve their required performance. This is done via a radiant cooler, connected via straps or even cryogenic heatpipes, depending on which temperatures have to be achieved. • For calibration purposes, there is a diffuser (for sun reference), a SLS (spectral line source for spectral calibration monitoring) and a WLS (white light source for Etalon monitoring). • UV-VIS channels are from RETICON , too.
Short tour through SCIAMACHY Instrument Differences to GOME-II Both instruments analyse the sun light, back scattered from the Earth atmosphere. But whereas GOME-II can observe in Nadir geometry only, SCIA can do Nadir and Limb (thanks to its so called Azimuth Scan Mirror ASM). • As a consequence of that, also solar and lunar occultation measurements can be performed. • That also multiplies the number of possible throughput monitoring measurements (see later slide). • Coatings on mirrors are different • SCIA: pure Al (no further coatings applied) • Chemically very inert though very critical during on-ground handling • GOME-II: UV enhanced MgF2 (? ) • Slightly better throughput in the UV (?) • Calibration diffusers are different • SCIA: sand-blasted Al • Drawbacks (spectral features in Solar reference) • GOME-II: Quasi-Volume Diffuser • Calibration lamps are more or less identical but SCIA does not have LEDs to monitor the detector only • Lamps could be expected to degrade the same (?) • Detector temperatures are different – SCIA seem to be slightly cooler (see next slide) • PMD channels • SCIA: 6 broad band PMDs for p polarised light only, 1 additional for 45 deg. Polarised input. PMD 1-3 cover the same range, but with different resolution than GOME-II • GOME 2: 3 PMD channels, but s & p, and with higher spectral resolution. • GOME-II detectors are connected to an “extraction pipe”, allowing the detector units to be evacuated and tested in cooled conditions without the need to evacuate/put the whole instrument under vacuum. • GOME-II detectors are cooled by Peltier elements, SCIA detectors are cooled passively (with trim heaters to stabilize)
Short tour through SCIAMACHY InstrumentSCIAMACHY sciene channels GOME-II detectors cover SCIA detectors 1-4. Temperatures of SCIA detectors are a bit varying by channel. In the VIS they appear to be even lower than GOME-II SCIA:(-69 to -46 deg. C) GOME-II: -38
Short tour through SCIAMACHY InstrumentSCIAMACHY PMD channels SCIA PMDs are only sensitive to p-polarized input. Also their spectral resolution is different. However, their thermal environment seems comparable (tbc).
SCIAMACHY monitoring concept (1) • Monitoring sources: • Sun, WLS, SLS (not shown) • Monitored Light paths (always to be seen per channel (science / PMD) • Nadir • Sun via Sub-solar port • WLS via ESM mirror • Limb • Sun in occultation, i.e. via Azimuth and Elevation mirror Calibration Sun via Azimuth mirror and diffuser (on rear side of Elevation mirror) IMPORTANT: ratios of different time series (e.g. sun-occultation/sun-sub-solar) yields information about degradation of single components, in this case the Azimuth mirror
SCIAMACHY monitoring concept (2) • Illuminated part of the orbit • Nadir measurements • Limb measurements • Solar occultation • Solar occultation, sun above atmosphere is used for monitoring the limb light path (every orbit) • In this region of the orbit, also the daily solar calibration (via diffuser is performed 1/day) • At about the equator, sun is viewed via subsolar port to monitor the nadir light path • (~1 per week) In direct sun view (i.e. via mirrors), an aperture Stop (mechanism) is used to reduce the flux onto the detectors.
Monitoring Results Channel 1 average signal vs time (1) • Degradation exists in all channels • Rate is changing with channel (see other plots, summary table) • but changing also with time • Up to 2004 ~ nothing • 2004: ~ 5% / year • As of 2005: ~ 10 % / year • 2 years of GOME II 5.5 years of SCIA • SCIA L2 quality still ok though some impact is thinkable • To be contacted: • IUP/Richter • ESRIN/Fehr • Red curve (WLS via ESM) contains also a degradation of the WLS. Else it should be comparable to Sun via ESM. This WLS degradation is not corrected for (tbc by Noel).
Monitoring Results Channel 1 average signal vs time (2) Ratio of dark blue (Sun via ASM mirror and ESM mirror) and Light blue curve (sun via ESM mirror) yield the degradation of the ASM mirror. As expected, the ASM mirror will show slower degradation rate, since it is used less frequent. Result will be (eyeball) between the diffuser curve (green) and the ESM curve (light blue). Although each light-path is monitored e2e, the major contribution – at least in the UV (and VIS/not shown yet) must be resulting from degradation of the mirror(s).
Monitoring resultsChannel 2 average & PMD A vs time Channel 2 and PMD (A) degrade qualitatively the same and therefore confirm the conclusion from previous slide (i.e. that it is driven by degradation of the mirrors) – as part of the common light path. Rates are already much lower than in the UV channel! However, degradation of PMD’s seems slightly less. After 6 years, Small differences to be noted, which could be artificial (tbc by SOST) The science channel is a bit broader than the PMD, hence the ch2 average could be a bit wrong when compared to PMD. Comparison of other science channel/PMDs looks similar.
Monitoring results Channel 1 pixel wise The same monitoring information can also be displayed as a function of pixel/wavelength (might be easier for comparison with GOME-II results). Even within a single channel, one can see clearly a 1/lambda dependency of the degradation. I.e. the shorter the wavelength, the stronger the effect. However, the intra-channel degradation differences seem to get stronger with time.
Channel 2 pixel wise Don’t get confused: The wavelength axis is upside down compared to channel 1 plots (inverted readout)! Also, in channel 2, the degradation is stronger, the shorter the wavelength.
Monitoring resultsChannel 8 – water ice (1) Average signal Channel 8 (T det. ~150 K!!!) Exponential throughput loss (proportional to ice growing on detector) Decontaminations unsuccessful – the ice came back, though it seemed to level of earlier (i.e. it is slowly leaving the system) At a certain moment in time it was thought to be more efficient to stop decontamination and live with a reduced, but acceptable throughput. SCIA decontamination: Indirect by heating the radiant cooler… Throughput monitoring only starts, once stable conditions are reached again! NO transient monitoring!!! (more details in SCIA handbook)
Monitoring resultsChannel 8 – water ice (2) An important observation: At the same time, the throughput goes down, the detector temperature increased (ice is warming up the detector / radiation effect). GOME-II, though not having IR channels, might learn from this SCIA feature degradation/ice growth rates could be compared Detector temperature should be looked at, too.
Summary • SCIA has got degradation in the UV-VIS, too. • It is considered to take place in the front end (mirrors, common light-path of science and PMD detectors. • The underlying mechanism isn’t really explained. It could be some organic material, disposed on the mirrors and being cracked by UV radiation with time. • Degradation shows 1/lambda dependency. • GOME-II, same type of instrument, also shows 1/lambda, but rates are stronger • Why? – This is still not answered. • More detailed comparison is necessary, including all channels, i.e. not limiting to UV, which of course is the most prominent one. • Detector temperatures deserve a closer look, too. • SCIA also has a water ice problem, which might be useful to compare to • check ice growth rates and related observations… • Is it possible to determine the ice layer thickness? • ESA would like to have WLS level 0 data • If it is not too much, just provide all WLS up and including throughput test II
Acknowledgements • SOST SCIA webpage (from here I took all my plots!) • http://atmos.caf.dlr.de/projects/scops/ • E. Krieg, Manfred Gottwald (DLR Oberpfaffenhofen) • S. Noel et al, IUP Bremen (Light-path monitoring) • (stefan.noel@iup.physik.uni-bremen.de) • 8 years + instrument history • Monitoring results (“Light paths – SOST-IFE”) • Instrument settings • Telemetry records • Operations Concept • Orbit Analysis (visibility of celestial sources) • but also “instrument handbook” on SOST page, click on this icon! • … • Simply: Everything about SCIA!