Download
1 / 16
160 likes | 324 Vues
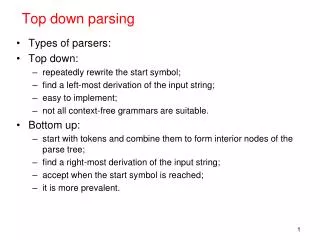
Deforestation Part 3: Top-down Modelling. Pedro R. Andrade São José dos Campos, 2013. Representing the process. How to develop a deforestation model?. Modelling and Public Policy. External Influences. System Ecology Economy Politics. Desired System State. Decision Maker.

E N D
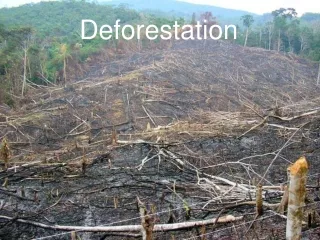
Deforestation Part 3: Top-down Modelling Pedro R. Andrade São José dos Campos, 2013
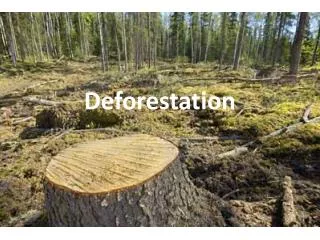
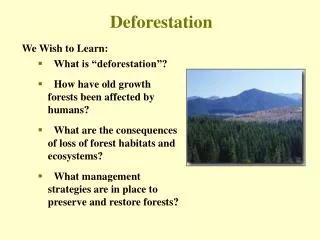
Representing the process How to develop a deforestation model?
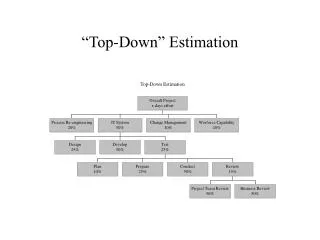
Modelling and Public Policy External Influences System Ecology Economy Politics Desired System State Decision Maker Scenarios Policy Options
Scenario tp + 10 Calibration Validation Models need to be Calibrated and “Validated” tp - 20 tp - 10 tp Source: Cláudia Almeida
Land use at t+1 Top-down Land Change Models Demandsubmodel Input data How much? Where? Transitionpotential submodel Changeallocation submodel Land use at t Time loop
Building Scenarios Trend analysis Global economic model Demand Transition Matrix (Markov chain)
Simple Demand Difference between years Demand submodel
Potential Driving factors Potential map Transition potential submodel Multivariate Statistics Mathematics Neural Network
Potential – CLUE like Deforestation Protected Areas Subtract from Roads Potential map Transition potential submodel Ports Deforestation
Demand t+1 Landscape map at t Allocation Allocation submodel • Rank-order • Stochastic • Iterative Landscape map at t+1 Potential map at t
deforestation.lua • Threestrategies for computingpotential: • Neighborhood: Basedontheaveragedeforestationofthe neighbors • Regression: Basedondistancetoroads, ports, andprotectedarea • Mixed: Basedonthese four attributes • Fixedyearlydemand
Goodness-of-fit Source: Costanza, 1989
Goodness-of-fit: Multilevel Source: Costanza, 1989
Exercise • Use the PRODES data as yearly demand (from “total-prodes.lua”) • Compute the final real deforestation summing up the deforestation data in 2001 with the yearly PRODES until 2011 • Use the multi-resolution metric to calibrate the different potential strategies by changing the weights manually (see an example of computing the goodness-of-fit in “check-fit.lua”) • Is it possible to be better than the allocation from the potential based only on the neighborhood?
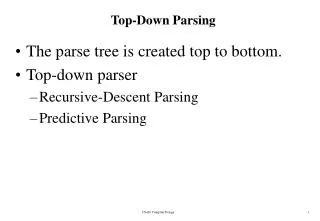
Land Change Models x Cellular Automata • Grid ofcells • Neighbourhood • Finite set ofdiscretestates • Finite set oftransitionrules • Initialstate • Discrete time • Behavior parallel in space • Readfromthe neighbors andwrite in thecell Can a top-downlandchangemodelbeconsidered a CellularAutomata?