Download
1 / 19
190 likes | 369 Vues
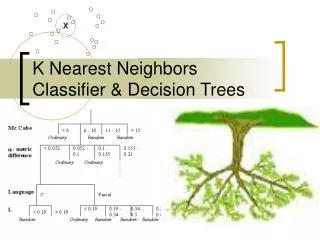
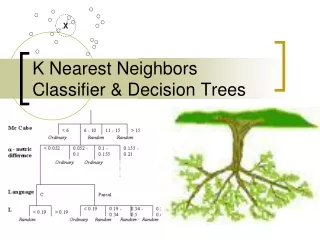
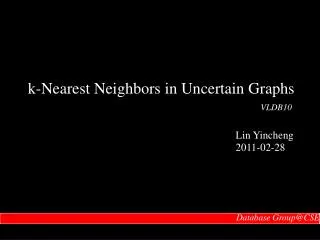
k-Nearest Neighbors in Uncertain Graphs. VLDB10. Lin Yincheng 2011-02-28. Outline . Background Motivation Problem Definition Query Answering Approach Experimental Results. Background. k-Nearest Neighbors. Uncertain Graphs. 15. 5. 15. 5. 5.

E N D
k-Nearest Neighbors in Uncertain Graphs VLDB10 Lin Yincheng 2011-02-28
Outline • Background • Motivation • Problem Definition • Query Answering Approach • Experimental Results
Background k-Nearest Neighbors Uncertain Graphs 15 5 15 5 5 Find out 2-nearest neighbors for vertex B
Motivation • Define meaningful distance functions which is more useful to identify true neighbors • Introduce a novel pruning algorithm to process knn queries in uncertain graphs. 15(0.2) 15(0.6) 5(0.4) 5(0.3) 5(0.7) most-probable-path-distance
Problem Definition • Assumption: Independence among edges • Probabilistic Graph ModelG(V, E, P, W) • V and E denote the set of nodes and edges respectively; • P denotes the probabilities associated with each edge; • W assigns each edge with a weight • k-NN Query
Distances • Median-Distance(s, t) • Majority-Distance(s, t) • Expected-Reliable-Distance(s, t)
Challenges • For computation of median-distance and majority-distance, we need to obtain their distributions over all possible worlds. • For computation of expected-reliable-distance, it has been proved as a #P hard problem.
Qualitative Analysis • Classification Experiment • Testing data: two classes, one is a triplet set of the form <A, B0, B1> and the other is a triplet set of the form<A, B1, B0> • A classifier: it tries to identify the true neighbors. • Measure: <False positive rate, True positive rate> • Data sets: Protein-protein interaction network DBLP Co-authorship network
ObservationMedian-D • Considering a new probability distribution • The below lemma could be achieved D is a distance value
Core Pruning Scheme • Query Transformation d D, M(s, t1) < d D, M(s, t2) => d M(s, t1) < d M(s, t2) d M(s, t1) >= d M(s, t2) => d D, M(s, t1) >= d D, M(s, t2)
Majority-D kNN Query Answering • The condition of d which is the exact majority distance should be Pr(d) >= 1 – P, P denotes the sum of visited nodes’ probabilities. • For the node which enters the kNN-set could be possibly replaced by another node with smaller majority distance at a later step.
Experimental Results • Dataset overview • Convergence of D-F Using the distance of a sample of 500 pws as the ground truth
Efficiency of k-NN Pruning The fraction of visited nodes (pruning efficiency) as a function of k Pruning efficiency as a function of sample size
Quality of Results Median-D Pruning efficiency as a function of edge probability Stability as a function of the number of possible worlds