Download
1 / 48
480 likes | 579 Vues
Decision Making with Progress Monitoring Data: Considerations in Determining Instructional Effectiveness John M. Hintze, Ph.D. University of Massachusetts National Center for Student Progress Monitoring hintze@educ.umass.edu www.studentprogress.org. Our Working RTI Model.

E N D
Decision Making with Progress Monitoring Data:Considerations in Determining Instructional EffectivenessJohn M. Hintze, Ph.D.University of MassachusettsNational Center for Student Progress Monitoringhintze@educ.umass.eduwww.studentprogress.org
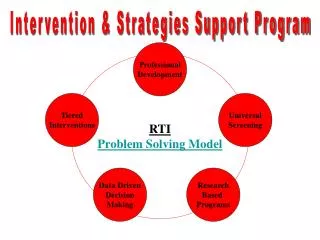
Our Working RTI Model • RTI relies on a multi-tier prevention system to identify students with academic skill weaknesses and LDs: • Primary prevention level (Tier 1) • Secondary prevention level (Tier 2) • Tertiary prevention level (Tier 3) • Each tier in the model is focused on a set of interrelated tasks: • Instructional Tasks • Assessment Tasks • Administrative/Managerial Tasks • Responsiveness is determined via a dual discrepancy analysis • Student performance relative to benchmark standards • Student performance relative to rate-of-improvement or growth standards
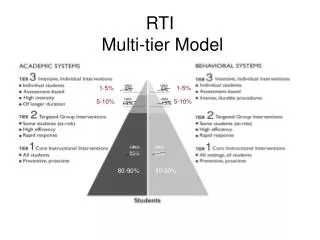
Continuum of Schoolwide Support Tertiary Prevention: Further intensified and individualized intervention ~5% Secondary Prevention: Intensified, validated intervention ~15% Primary Prevention: Schoolwide and classwide instruction ~80% of students
Basics of RTI • Primary Prevention (Tier 1): • All student receive a research supported core curriculum • All students screened seasonally (Fall, Winter, & Spring) to determine which students are suspected to be at risk. • Students suspected to be at risk remain in primary prevention and their progress is monitored for 4 to 8 weeks. • Progress monitoring in Tier 1 is used too: • Disconfirm risk. These responsive students remain in primary prevention. • Confirm risk. These unresponsive students move to secondary prevention.
Basics of RTI • Secondary Prevention (Tier 2): • Supplemental manualized intervention is provided in flexible groups for anywhere from 10-15 weeks • Student progress is monitored weekly • Student responsiveness is assessed continually : • Students who are responsive to Tier 2 intervention return to Tier 1 • Students who are under-responsive to Tier 2 intervention move to tertiary Tier 3 intervention
Basics of RTI • Tertiary Prevention (Tier 3): • Intensified individualized intervention (may or may not involve special education services) • Student progress is monitored weekly • Progress monitoring is used to: • Set Individualized education program (IEP) goals. • Design individualized instructional programs. • Monitor student response. • When progress monitoring indicates that a student has met benchmark performance standards, student exits Tier 3 (or special education), and returns to primary (Tier 1) or secondary (Tier 2) prevention, with ongoing progress monitoring.
Three Tiers of RTI TIER 1: Primary Prevention - General education setting - Research-supported instruction - Screening to identify students suspected to be at risk - PM to (dis)confirm risk status AT RISK TIER 2: Secondary Prevention - Supplemental researched-based intervention - PM to assess responsiveness RESPONSIVE UNRESPONSIVE TIER 3: Tertiary Prevention - Intensified/Individualized intervention (special education) - PM to set IEP goals - PM to formulate individualized programs - PM to assess responsiveness RESPONSIVE UNRESPONSIVE
Summary • Screen all students to identify suspected at-risk students. • Monitor progress of students suspected to be at risk to (dis)confirm risk. • Provide supplemental standardized intervention to at-risk students, while progress is monitored to assess response.
Summary • Students who are under-responsive to secondary preventative intervention are moved to tertiary intervention where intensified/individualized intervention is provided (may or may not be under the auspices of special education). • Progress is formatively monitored to tertiary intervention to determine effective programs and IEP goals are set (for students in classified for special educaiton), and determine exit decisions.
So, RTI Is Embedded Within a Multi-Tier Prevention System: Analogy to Health Care • High blood pressure (HBP) can lead to heart attacks or strokes (like academic failure can produce serious long-term negative consequences). • At the annual check-up (primary prevention), HBP screening (like annual fall screening for low reading or math scores). • If screening suggests HBP, then monitoring over 6-8 weeks occurs to verify HBP (like PM to ([dis]confirm risk). • If HBP is verified, second prevention occurs with relatively inexpensive diuretics, which are effective for vast majority, and monitoring continues (like small-group Tier 2 intervention, using a supplemental standard treatment protocol, with PM to index response). • For patients who fail to respond to secondary prevention (diuretics), then tertiary prevention occurs—experimentation with more expensive medications (e.g., ACE inhibitors, beta blockers), with ongoing monitoring, to determine which drug or combination of drugs is effective (like individualized instructional programs inductively formulate with progress monitoring).
Setting Goals & Making Decisions within the Three Tiers of RTI
Tier 1—Primary Prevention • All students screened using CBM • Students scoring below benchmark are suspected at risk for reading or math difficulties • Suspected at-risk students monitored for 4 to 8 weeks during primary prevention using CBM and their risk-status is confirmed or disconfirmed
Tier 1—Primary Prevention:Screening for Possible Reading Risk R-CBM
Tier 1—Primary Prevention:Confirming Risk Status With Progress Monitoring • At the end of 4–8 weeks, student risk status is confirmed or disconfirmed via progress monitoring
Tier 1—Primary Prevention:Confirming Risk Status With PM Anne’s Slope = 1.00
Tier 1—Primary Prevention:Screening for Possible Math Risk M-CBM X Keep an eye on Anne to see if she “catches up”
Arthur’s slope= 0.0 Tier 1—Primary Prevention:Confirming Risk Status With PM
Tier 1—Primary Prevention:Screening for Possible Math Risk M-CBM Arthur is not responding to the core curriculum and should move to Tier 2
Tier 1—Primary Prevention:Review • All classroom students screened to identify suspected at-risk students. • Suspected at-risk students remain in primary prevention and are monitored using CBM for 4–8 weeks: • Students with adequate slopes remain in primary prevention. • Students with inadequate slopes move to Tier 2 (secondary prevention).
Tier 2—Secondary Prevention • Use the same goal setting and decision making standards as in Tier 1 • In addition to the core curriculum, students in Tier 2 receive supplemental manualized intervention for 10 to 15 weeks • At the end of Tier 2 intervention, student benchmark and growth status as evaluated • Students at or above benchmark return to Tier 1 • Students below benchmark, but making adequate (or exceeding) growth progress may be maintained in Tier 2 • Students below benchmark and continuing to demonstrate poor growth progress (i.e., under-responding) are moved to Tier 3
Tier 3—Tertiary Prevention • Intensified/individualized programs are formulated for individual or small groups (2-3) of students • For students who are classified (i.e., receiving special educational services) IEP goals are established.
Tier 3—Tertiary Prevention: Goal Setting • Three options for setting IEP goals: • Aggregated benchmark estimates • Aggregated rate of improvement (growth) estimates • Intra-individual framework
Tier 3—PM in Tertiary Prevention: Setting Goals With End-of-Year Benchmarking • Setting IEP goals • End-of-year benchmarking • Identify appropriate grade-level benchmark • Mark benchmark on student graph with an X • Draw goal-line from the baseline CBM scores to X
Tier 3—PM in Tertiary Prevention: Setting Goals With End-of-Year Benchmarking M-CBM
Tier 3—Tertiary Prevention: Setting Goals With End-of-Year Benchmarking end-of-year benchmark X goal-line X baseline
Tier 3—Tertiary Prevention: Setting Goals With Rate of Improvement Standards M-CBM
Tier 3—Tertiary Prevention: Setting Goals With Rate of Improvement Standards • Setting IEP goals: • Rate of Improvement Standards • First three scores average (baseline) = 14 • Norm for fourth-grade computation = 0.50 • Multiply norm by number of weeks left in year • 16 0.50 = 8 • Add to baseline average • 8 + 14 = 22 • Student’s end-of-year goal is 22
Tier 3—Tertiary Prevention: Setting Goals With Rate of Improvement Standards goal-line x x
Tier 3—Tertiary Prevention: Setting Goals WithIntra-Individual Framework • Setting IEP goals: • Intra-individual framework • Identify weekly rate of improvement (slope) using at least eight data points • Multiply slope by 1.5 • Multiply by number of weeks until end of year • Add to student’s baseline score • This is the end-of-year goal
Tier 3—Tertiary Prevention: Setting Goals WithIntra-Individual Framework Slope = 0.625
Tier 3—PM in Tertiary Prevention: Setting Goals With Intra-Individual Framework • Setting IEP goals • Intra-individual framework • Identify weekly rate of improvement using at least eight data points • First eight scores slope = 0.625 • Multiply slope by 1.5 • 0.625 × 1.5 = 0.9375 • Multiply by number of weeks until end of year • 0.9375 × 12 = 11.25 • Add to student’s baseline score • 11.25 + 12.00 = 23.25 • 23.25 (or 23) is student’s end-of-year goal
Tier 3—Tertiary Prevention: Setting Goals WithIntra-Individual Framework x
Tier 3—Tertiary Prevention:Decision Making with Formative Progress Monitoring Data • Interpretative Approaches • Visual Analysis • Useful in evaluating practice when changes (either level or slope) are obvious • Based on baseline logic which can be an impediment • Analysis of Trend • With reliable and sufficient data can make adequate formative decisions • More data means better decisions • Errors in decision making are affected by variability in the data • Tests of Statistical Significance • Hypothesis Test for Slope
Analysis of Trend • Decision rules for progress monitoring data: • Based on four most recent consecutive scores • Based on student’s trend-line
Tier 3—Tertiary Decision Making: Four-Point Method most recent 4 points X goal-line
Analysis of Trend • Based on four most recent consecutive scores • If the four most recent consecutive scores are all above the goal-line, keep the current intervention and increase the goal
Tier 3—Tertiary Decision Making: Four-Point Method X goal-line most recent 4 points
Analysis of Trend • Based on four most recent consecutive scores • If the four most recent consecutive scores are all above the goal-line, keep the current intervention and increase the goal • If the four most recent consecutive scores are all below the goal-line, keep the current goal and modify the instruction • When the four most recent consecutive scores are neither above or below the goal-line, maintain the current goal and instruction and continue to progress monitor
Tier 3—Tertiary Decision Making Based on Trend trend-line X X goal-line
Analysis of Trend • When the trend-line is steeper (i.e., accelerating) relative to the goal-line, keep the current intervention and increase the goal • When trend-line is lower (i.e., decelerating) relative to the goal-line, keep the current goal and modify the instruction • When the trend-line is equal (i.e., parallel) to the goal-line, maintain current goal and instruction and continue to progress monitor
Tier 3—Tertiary Decision Making Based on Trend X goal-line X trend-line
Analysis of Trend • When the trend-line is steeper (i.e., accelerating) relative to the goal-line, keep the current intervention and increase the goal • When trend-line is lower (i.e., decelerating) relative to the goal-line, keep the current goal and modify the instruction • When the trend-line is equal (i.e., parallel) to the goal-line, maintain current goal and instruction and continue to progress monitor
We’ve also found ….. • In order to get “reliable” data, 16 to 20 data points are probably needed • Up to about six weeks, a pre- post-test analysis of difference scores is more reliable than analysis of trend • BUT …… • Decision making can be improved when reliability of the measurement system is improved
Hypothesis Test for Slope t=b1/SEb1 = 1.71/.35 = 4.89 Slope = 1.71 t with 6 df = 1.94 Significant > 0.005 Standard Error = 0.35