Download
1 / 11
150 likes | 510 Vues
Classification of Breast Tissue Using Electrical Impedance Spectroscopy. Mike Nonte. Electrical Impedance Spectroscopy. Apply voltage or current with known frequency and amplitude Record current or voltage response Use phase shift and change in magnitude to determine complex impedance

E N D
Classification of Breast Tissue Using Electrical Impedance Spectroscopy Mike Nonte
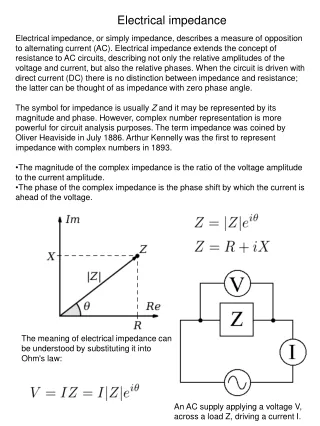
Electrical Impedance Spectroscopy • Apply voltage or current with known frequency and amplitude • Record current or voltage response • Use phase shift and change in magnitude to determine complex impedance • Sweep through a range of frequencies to produce a nyquist plot
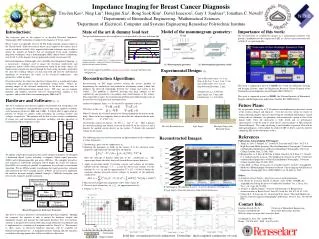
Breast Tissue Classification • Data Set • EIS recordings from 106 freshly excised breast tissue samples • Each sample belongs to one of six tissue types: • Carcinoma • Fibro-adenoma • Mastopathy • Glandular • Connective • Adipose • Problem: use pattern classification techniques to reliably determine tissue type from EIS recordings
Proposed Method • Replace ELMs with MLPs and compare computation speed and accuracy [2]
Feature Extraction • Publically available data has nine features already extracted: • I0: Impedance at zero frequency • PA500: Phase angle at 500kHz • HFS: High-frequency slope of phase angle • DA: Impedance distance between spectral ends • AREA: Area under the nyquist plot • A/DA: AREA normalized by DA • MAX OP: Maximum of the spectrum • DR: Distance between I0 and real component of the maximum frequency point • P: Length of the spectral curve
Feature Selection • Previous work [2] uses mutual information to rank attribute strength then tests different feature vector dimensions to determine which yields best results • Only 9 feature attributes, so an exhaustive subset selection approach is slow but possible • Randomly split data into equally sized testing and training sets • Train a single ELM and measure classification rate with each possible set of attributes • Determine optimal feature vector
Future Work • Short-term • Apply ELM outputs to multi-class SVM • Replace ELMs with MLPs and compare speed and accuracy of classification • Long-term • Obtain larger data set to ensure generalization of results • Examine new attributes that may be more useful in determining a physiological basis for observed impedance properties
References [1] Williams, J. C., Hippensteel, J. A., Dilgen, J., Shain, W., & Kipke, D. R. (2007). Complex impedance spectroscopy for monitoring tissue responses to inserted neural implants. Journal of neural engineering, 4(4), 410. [2]Daliri, M. R. (2013). Combining extreme learning machines using support vector machines for breast tissue classification. Computer methods in biomechanics and biomedical engineering, (ahead-of-print), 1-7.