Download
1 / 28
280 likes | 286 Vues
Learn about the different factors that affect atmospheric seeing and how they impact the clarity of observations through telescopes. Explore the macro-scale, meso-scale, and micro-scale causes of poor seeing and discover ways to mitigate their effects.

E N D
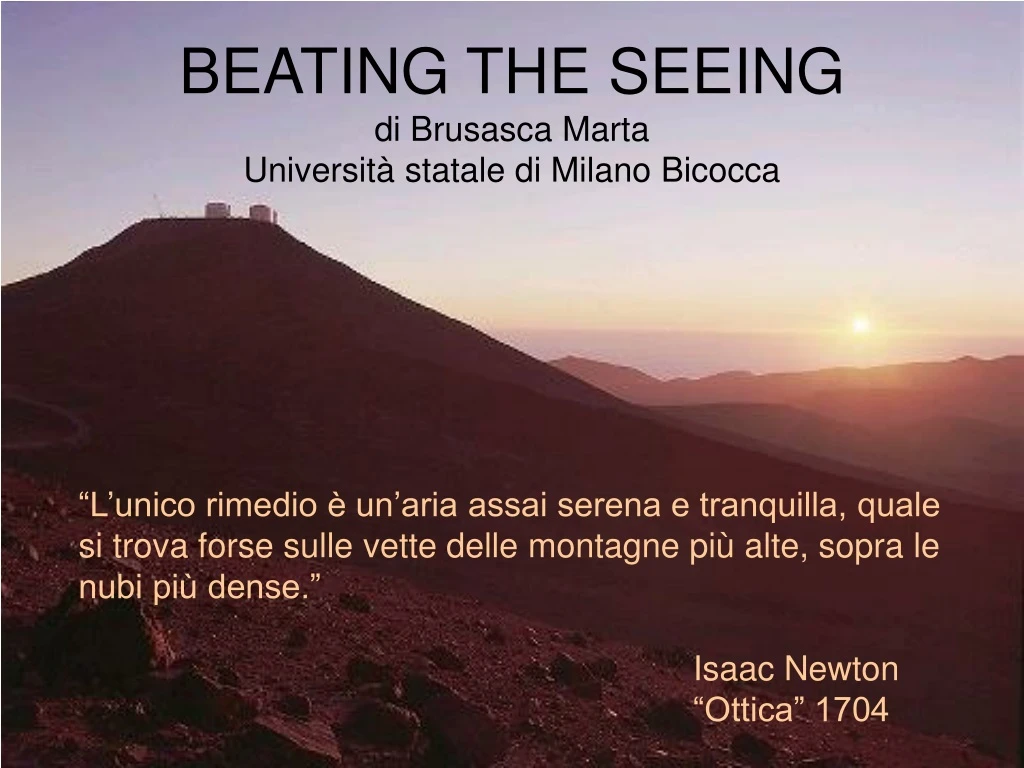
BEATING THE SEEINGdi Brusasca MartaUniversità statale di Milano Bicocca “L’unico rimedio è un’aria assai serena e tranquilla, quale si trova forse sulle vette delle montagne più alte, sopra le nubi più dense.” Isaac Newton “Ottica” 1704
THE ATMOSPHERE • The Earth's atmosphere has usually different effect that are divided in: • Refraction (atmosferic dispersion) by dust and molecules causes the sky background to have a certain intrinsic brightness, and it is this which impose a limit upon the faintest detectable object through the telescope. • Extinction (atmosferic absorption): is due mostly to the molecular absorption bands of the gases forming the atmosphere; the two well know window in the spectrum extended from about 360 nm to 100 m and from 10 mm to 10 m, but even in these regions there is some absorption so visible light is decrease in its intensity by 10 or 20% for vertical incidence. • Seeing is the distortion of the radiation wavefront of a cosmic source, produced by variation in the index of refraction of air. • It’s usually divided in: ATMOSPHERIC SEEING • DOME SEEING
ATMOSPHERIC SEEING Poor seeing is caused by atmospheric turbulence. It can occur in three main regions within the telescope viewing path, each of which is associated with different mechanisms of turbulence generation. From the lowest to the highest altitudes, these regions are near ground seeing (0 – 100 m) central troposphere (100m – 2km), and high troposphere (6-12km). These scales are defined as: the macro-scale the meso-scale the micro-scale
THE MACRO-SCALE Jet stream (fast moving “rivers” of air ) One of the major causes of turbulence is the strong wind (speeds sometimes exceeding 300 mph) and steep temperature gradients found in the vicinity of the jet stream. Areas of the Northern hemisphere most affected by the Polar jet stream are the Central US, Canada, North Africa, and Northern Japan. The Jet stream’s position varies with the seasons, tending to move further South during the winter and spring months. Cold front A weather front exists at the interface of two air masses of different temperatures and/or moisture content. The cold air undercuts warm air, forcing it aloft. Because of this vertical lifting, and because cold air is susceptible to convection, the turbulence in the vicinity of a cold front is usually great. Thermal instability Instability is a term used to describe the tendency for the air to undergo vertical motion. An unstable atmosphere encourages air to rise initially, then fall after undergoing adiabatic cooling. This tends to result in the generation of convective currents of air. Strong surface heating and cold temperatures aloft will produce the greatest levels of instability. Conversely, a stable atmosphere tends to discourage vertical air motion. Atmospheric processes that tend to cause cooling at the surface and warming aloft (thermal inversion) produce highly stable air that is largely free of this type of turbulence.
Surface Pressure Gradient Winds at the ground normally blow in response to broad-scale pressure patterns Once it is set into motion, air becomes susceptible to certain kinds of turbulence. While in theory it is true that extremely stable moving air can be turbulent-free (laminar flow), such conditions rarely occur. The assumption here is that higher wind velocities tend to result in higher levels of turbulence. Terrain Roughness At the lowest level of the atmosphere the horizontal movement of air is impeded by the ground. This frictional drag introduces a form of mechanical turbulence into the boundary layer of the atmosphere. A relatively smooth, uncluttered ground will produce low levels of turbulence, while a rough ground with high relief will disturb the air to a greater degree. THE MESO-SCALE The turbulence at these altitudes is determined largely by the topography upwind of the observing site.
THE MICRO-SCALE Site Terrain The type of terrain that surrounds an observing site may cause movements of air that degrade the quality of seeing. If there are uneven ground features nearby (such as the steep slopes of a mountain or hill, gorges or gullies), then nocturnal drainage may generate moving currents of relatively dense air that can adversely impact image quality. Ground Type The type of ground cover immediately surrounding an observing site will often impact the quality of seeing. If the ground is allowed to heat up during the daylight hours by absorbing the sun’s short-wave radiation, that stored heat will be reradiated back into space during the night, causing micro-scale turbulence in the process. Surfaces that either dissipate or reflect sunlight minimize this effect. Natural ground cover such as grass or leafy shrubs tends to distribute the sun’s energy in ways that keep the temperature of these surfaces relatively cool.
THE DOME SEEING Also the telescope itself can perturb the image, if it hasn’t reached ambient temperature, this will result in a “boiling effect” when viewing. One should leave their scope for at least 1 hr prior to observing and probably longer. Certain types of telescope and observatory are more prone to turbulence: Newtonian reflectors can be troublesome if not properly ventilated, as can Schmidt Cassegrain’s if not left to cool for long enough. If the objective is not at air temperature, it will surround itself with a wavy, irregular envelope of air slightly warmer or cooler than the ambient night.
Installing a fan behind a reflector's mirror has become a popular way to speed cooling and blow out mixed-temperature air THE DOME SEEING (2) Left: Cooling fans are traditionally mounted behind a reflector's primary mirror, but inventor Alan Adler has shown that you can break up heat waves better by placing the fan in the tube's side so it blows across the mirror's face. Right: Opposite the fan, Adler put exhaust holes that allow warm air to exit the tube. Note that they're slightly offset to the rear of the tube to help ensure that the flowing air "scrubs" the mirror before leaving.
THE DOME SEEING (3) An example: A constant gentle breeze across a reflector's primary mirror is so important that astronomers built a dome with removable sides for the 8-meter Gemini North reflector atop Mauna Kea in Hawaii.
ZENITH The seeing is always worse at low altitude in the sky. The altitude influence the seeing because when we observe a point down the horizon, the light must cross a lot of air boundaries than a point placed at the zenith. The light of an object placed at 25° on the horizon has to cross 4 time the air that pass an object at the zenith. For this reason is better to observe an object when is at the max height. Atmospheric dispersion elongates a star into a colorful little spectrum; close to the horizon this effect overtake even poor seeingas a cause of blurry images.
Many scales have been devised to rate how steady the atmosphere is on a given night. This scale of seeing is the Pickering Scale, devised by Harvard Observatory's William H. Pickering (1858-1938). Pickering used a 5-inch refractor to devise the scale. 1. Star image is usually about twice the diameter of the third diffraction ring if the ring could be seen; star image 13" in diameter. 2. Image occasionally twice the diameter of the third ring (13"). 3. Image about the same diameter as the third ring (6.7"), and brighter at the centre. 4. The central Airy diffraction disk often visible; arcs of diffraction rings sometimes seen on brighter stars. 5. Airy disk always visible; arcs frequently seen on brighter stars. 6. Airy disk always visible; short arcs constantly seen. 7. Disk sometimes sharply defined; diffraction rings seen as long arcs or complete circles. 8. Disk always sharply defined rings seen as long arcs or complete circles, but always in motion. 9. The inner diffraction ring is stationary. Outer rings momentarily stationary. 10. The complete diffraction pattern is stationary. Note: On this scale 1-2 is very poor, 3-4 is poor, 5 is fair, 6-7 is good, 7-8 very good, and 8-10 excellent. A SCALE OF SEEING These photos show the double star Zeta Aquarii which has a separation of 2 arcseconds being messed up by atmospheric seeing.
A SCALE OF SEEING (2) In Italy, to measure the seeing we use the Antoniardi’s scale that gives a value from I to V taking in account the effect of distortion. I = excellent condition: the image is practically perfect II = good condition: the image is stable for long periods III = medium condition: the image is troubled and blurry but there are brief period of stable images IV = bad condition: the image is always fuzzy V = it’s impossible to do observations The turbulence is something instable and it’s non simple to assign the right value of seeing. Usually it’s possible to use middle value as I-II or III-IV. A drawing of Jupiter simulated to show 3 different views: (far left) under excellent seeing, (centre) under fair seeing, and (far right) very poor seeing.
THE SITE Good intrinsic site seeing quality is important, ifnot crucial to most astronomical observations. The world’s finest locations for a stable atmosphere are mountain top observatories, located above frequently occurring temperature inversion layers, where the prevailing winds have crossed many miles of ocean. Sites such as these are: La Palma, Tenerife, Hawaii, Paranal etc,that frequently enjoy superb seeing much of the year. Also a major factor is generally unvarying weather patterns, dominated by large anti-cyclones (High pressure systems).
ENO – European North Observatory Observatory TEIDE Location Tenerife Surface area 50 hectares Altitude 2.390 metres Longitude 16º 30' 35" West Latitude 28º 18' 00" North Observatory ROQUE DE LOSMUCHACHOS Location La Palma Surface area 189 hectares Altitude 2.396 metres Longitude 17º 52' 34" West Latitude28º 45' 34" North
ENO – TEIDE VTT(Vacuum Tower Telescope) Solar labour Infrared telescope "Carlos Sánchez" VTT Solar telescope(France-Italy) THEMIS
ENO - ROQUE DE LOSMUCHACHOS New solar telescope Sueco (NSST), 1 m WHT Solar telescope Abierto Holandés (45 cm) Telescope "William Herschel", (WHT) 4,2 metre
TNG - Telescopio Nazionale Galileo The Telescopio Nazionale Galileo (TNG), with a primary mirror of 3.58m, is the national facility of the Italian astronomical community.
ENO – Historical Perspective The quality of the Canarian skies for observational astronomy has long beenrecognised. As far back as 1856, the Astronomer Royal for Scotland conductedastronomical experiments on the mountain summits of the island of Tenerife. Heconcluded that the skies above the Canary Islands were ideal for astronomical Observations. These early conclusions were later confirmed by, among others, Jean Mascart in1910 during an expeditiontostudy Halley's Comet: Mascart reported that the cold ocean currents surrounding theCanaryIslands in combination with the trade winds, provide a unique stableclimate with little atmospheric turbulence. In 1968 a collaboration was established among a number of Europeaninstitutes and an extensive site-testingcampaign began, identifying La Palma andTenerife as the best observing sites.This international collaboration was formalized in 1979 with the signing of theInternational Agreements and a specific law approved in 1988. This makes theIAC's Observatories a legally protected site (in effect an astronomical "reserve")where continued dark skies, low radio frequency fields, and control over othersky-polluting effects are guaranteed.
ENO - Sky Background The brightness of the moonless night sky above La Palma has been measured from hundreds of CCD imagestaken with the 2.5-m Isaac Newton and 1.0-m Jacobus Kapteyn Telescopes between 1987 and 1996. The2 median sky brightness, in units of magnitude per arcsec , at high elevation, high galactic latitude and high ecliptic latitude, at sunspot minimum, is B=22.7, V=21.9, R=21.0, U~22.0, I~20.0. The contribution of light pollution to the continuum brightness at the zenith is <0.03 mag in all bands. TheSodium D emission brightens the sky in both V and R broad bands by about 0.07 mag. Total contamination(line plus continuum) at zenith is <0.03 mag in U, ~0.02 in B, ~0.10 in V, and ~0.10 in R. Typicalspectrum of the La Palma sky on a moonless night. Most of thedistinctive features of the night-sky spectrum are due to airglow. TheNaD emission at 5890/6 A is partly due to street lighting, while the mercury emission at 4358, 5461 A is wholly so. With the exception ofthe 8645-A O_2 line, the featuresdominating the spectrum redward of 6500 A are rotation-vibration bands of OH.
ENO - Atmospheric Transmission Long-baseline extinction values for ORMhave been measured by the CarlsbergMeridian Telescope in the V band (and morerecently in the Sloan r' band). During photometric, dust-free nights medianextinction is: 0.19 mag (at 480 nm), 0.09 mag(at 625 nm) and 0.05 mag (at 767 nm). In summer over 75% of the nights arefree of dust (there are short periods of higher extinction due to Saharandust in the atmosphere), while at other times of theyear over90% of the nights are dust free. Extinction in V is less than 0.2 mag onobserving nights over approximately 88% of thenights, and extinction in excess of 0.5 mag onlyoccurs less than 1% of the nights. Frequency of extinctionover the ORM duringwinter (top) andsummer period (centre).In both cases the modalvalue is found at 0.11mag/airmass. TheirCorresponding cumulative frequenciesare also shown(bottom). The verticalline indicates theextinction coefficientlimit for dusty nights,k > 0.153 vmag/airmass.
ENO - Image Quality and Atmospheric Turbulence Good intrinsic site seeing quality is important, ifnot crucial to most astronomical observations. A number of site testing campaigns now provideobjective evidence for the quality of the site. Usinga Differential Image Motion Monitor (DIMM) the free atmosphereseeing was measured over long time intervals andat different places (at times simultaneously) at theORM. These results show that the mean seeingover the years is 0.67 arcsec.Under typical seeing conditions, image qualitydoes not depend on the particular location andshows a high degree of homogeneity over the whole Observatory.A seasonal variation is noticeable, better seeing conditionsappearing during the summer, coinciding with a well-definedinversion layer due to the high prevalence of trade winds. Duringthe summer, 50% of the time seeing is better than 0.54",valuewhich reaches down to 0.4-0.46" during June-July.
Only La Silla, Paranaland ORM have systematic seeing measurementstaken with calibrated instruments. To evaluatethe contribution of the free atmosphere,the boundary layer and the surface layer toimage degradation, several intensive site-testing campaignshave been carried out using: equipped balloon soundings(CN2 profiles, water vapour, wind velocityand direction) +DIMMs and meteorological towersequipped with microthermal sensors. ENO - Image Quality and Atmospheric Turbulence (2) TNG The FREE ATMOSPHERE has an exceptionallylow contribution (0.4"), comparable to thevalues measured at La Silla (0.34") and MaunaKea (0.46"). The SURFACE LAYER(from 6 up to12m) is almost negligible (0.08").
ESOwas created in 1962 and is supported by eleven countries: Belgium, Denmark, Finland, France, Germany, Italy, the Netherlands, Portugal, Sweden, Switzerland and United Kingdom. ESO operates three sites in the Atacama desert region in Chile. The Very Large Telescope (VLT) on Paranal is located on a 2.600 m high mountain some 130 km south of Antofagasta. The VLT consists of four 8.2-meter and several 1.8-meter telescopes. These telescopes can also be used in combination as the VLT interferometer (VLTI). All four telescopes and five large state-of-the-art multi-mode astronomical instruments are now in operation. The VLTI had "First Light" in March 2001. The La Silla Observatory is located 600 km north of Santiago de Chile, at 2.400 m altitude, and consists of a series of optical telescopes with diameters up to 3.6 m . The third site is the 5,000 meter high Llano de Chajnantor, near San Pedro de Atacama. Here a new submillimeter telescope (APEX) is being completed, and a large submillimeter interferometer array of 64 antennas (ALMA) is under development. ESO – European Southern Observatory
Definitions and Terminology • Astronomical seeing is the distortion of the radiation wavefront of a cosmic source, producedbyvariations in the index of refraction of air. In conditions that are conducive to astronomicalobservations, pressure and water vapor fluctuations are negligible, thus variations in the indexof refraction result primarily from thermal fluctuations associated with turbulent air flow. • Thetemperature structure function of an atmospheric layer at altitude h above the ground is defined inthe form: • (1) DT (r, h) =< T(r, h)2 > • where T(r, h) is the temperature difference between two points separated by a distance r, atconstant altitude. • DT is generally described by a power law of the form: • DT(r) ∝ rb • where b = 2/3 (Tatarski 1961). The proportionality in equation 2 is mediated by the scale independent temperature structure parameter (Roddier 1981): • (3) • which relates to the refractive index structure parameter via: • (4) • where the units of C2n, pressure P(h) and temperature T(h) are respectively m-2/3, mb and K.
Definitions and Terminology (2) The spatial coherence scale of atmospheric turbulence is expressed by the Fried parameter r0 (in m): (5) where k is the wavenumber in m-1, ZA the zenith angle of the line of sight and h0 the elevation ofthe telescope above the ground in m. Finally, the full–width at half–maximum of a stellar image at a wavelength is (6) In other words, for a telescope of diameter D turbulence degrades the image resolution from Qdiff=l/Dto the diffraction limit which would be observed with a telescope of aperture r0, Qfwhm/ =l/r0. Since r0 ∝ k-6/5, as indicated by Equation 5, and l= 2p/k, then (7) All layers of the atmosphere contribute to seeing, as illustrated by Equation (5)
HOW MUCH DOES THE SEEING COST? NASA spent $2.1 billion to escape from poor atmospheric seeing; that's what it cost to put the Hubble Space Telescope in orbit.
“Astronomical seeing” Ron Thorkildson, web site of Rose City Astronomers • “Paul Conteau on atmosferic seeing” web site of Rose City Astronomers • “The atmosphere and observing” Damian Peach • “Beating the seeing” Alan M. MacRobert, • “Astrophysical techniques” C. R. Kitchin • “Reflecting Telescope OpticsII” R.N.Wilson • “Il Seeing” di G. De Santis e L. Zucchi • “The Optical/Infrared Astronomical Quality of High Atacama Sites. I.Preliminary Results of Optical Seeing” Giovanelli et al. • “Ottica Adattiva”J.W.Hardly (articolo Scienze agosto 1994) • www.iac.es • www.tng.iac.es • www.eso.com • www.skyandtelescope.com • www.rca-omsi.org BIBLIOGRAFIA