Download
1 / 23
230 likes | 299 Vues
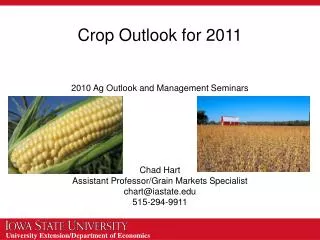
Grains Outlook for 2011. Insuring Iowa’s Agriculture Ames, Iowa Nov. 9, 2010 Chad Hart Assistant Professor/Grain Markets Specialist chart@iastate.edu 515-294-9911. U.S. Corn Supply and Use. Source: USDA. Source: USDA-NASS. Translates to a yield in the 170-175 bu. range.

E N D
Grains Outlook for 2011 Insuring Iowa’s Agriculture Ames, Iowa Nov. 9, 2010 Chad Hart Assistant Professor/Grain Markets Specialist chart@iastate.edu 515-294-9911
U.S. Corn Supply and Use Source: USDA
Translates to a yield in the 170-175 bu. range Translates to a yield around 160 bu. Source: USDA-NASS
U.S. Soybean Supply and Use Source: USDA
Within a bushel of each other Source: USDA-NASS
World Corn Production Source: USDA
World Soybean Production Source: USDA
La Niña Winter Source: NOAA
Clearing Old Stocks The current stocks set-up is reminiscent of the transition between the 2006 and 2007 crops. Source: USDA
Hog Crush Margin The Crush Margin is the return after the pig, corn and soybean meal costs. Carcass weight: 200 pounds Pig price: 50% of 5 mth out lean hog futures Corn: 10 bushels per pig Soybean meal: 150 pounds per pig Source: Shane Ellis, ISU Extension
Cattle Crush Margin The Crush Margin is the return after the feeder steer and corn costs. Live weight: 1250 pounds Feeder weight: 750 pounds Corn: 50 bushels per head Source: Shane Ellis, ISU Extension
Historical Export Levels Week 9 of marketing year Source: USDA, FAS
Corn Export Shifts Source: USDA, FAS
Soy Export Shifts Source: USDA, FAS
Iowa Corn Prices vs. Costs Right now, futures are in $5.40 range for 2010 and 2011 corn Even with higher fertilizer costs, corn’s profitable
Iowa Soybean Prices vs. Costs Futures are nearly $12 for 2010 and 2011 beans
This Year Soy $12.10 Corn $5.43
Thoughts for 2011 and Beyond • General economic conditions • Continued economic recovery is a major key for crop prices • Long-term oil price remain in the $90 range • Supply/demand concerns • Stocks: 2009 vs. 2010 crop • South America: La Niña impacts • Biofuels: E10, E12, or E15; Do the tax credits get extended/renewed? • Will supply be able to keep pace with demand? • 2010/11: USDA: Corn $5.20, Soy $11.45 Futures (as of 11/8/2010): Corn $5.46, Soy $11.80 • 2011/12: Futures (as of 11/8/2010): Corn $5.34, Soy $11.71
Thank you for your time!Any questions?My web site:http://www.econ.iastate.edu/~chart/Iowa Farm Outlook:http://www.econ.iastate.edu/outreach/agriculture/periodicals/ifo/Ag Decision Maker:http://www.extension.iastate.edu/agdm/