Download
1 / 34
340 likes | 436 Vues
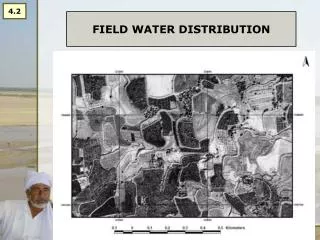
Glengonnar Water Field Results and What Next. Mouse Water Camps Water Glengonnar Water. Land Use & Geography. Slope. 11.13 km from Source to confluence with River Clyde. Land Use & Geography. Need to consider Land Use Slope Altitude Rainfall Water Use Land Runoff. Data Gathered.

E N D
Mouse Water Camps Water Glengonnar Water
Slope 11.13 km from Source to confluence with River Clyde
Land Use & Geography • Need to consider • Land Use • Slope • Altitude • Rainfall • Water Use • Land Runoff
Data Gathered • Fisheries Survey • Invertebrate Survey • Water Velocity • River Discharge • Substrate Size • Water Chemistry • Land Use • Geography
Water Velocity - Oranges • Timed how long it took for an orange to travel 10m
Water Velocity - Oranges • Used equation: speed = distance ÷ time
Water Velocity – Flow Meter • Recorded the number of revolutions per minute and converted using an equation
VelocityOrange vs Flow Meter • Orange = 0.58m per second • Flow Meter = 0.25m per second Are these comparable results?? NO!!!!
River Discharge - Results Average River Discharge = 0.23m3s
Substrate Size • Measured 100 random pieces of substrate • Average size 8.1 cm
Erosion, Transportation or Deposition • Substrate = 8.1 cm • Velocity = 0.25 cm/sec We need to consider all the different sized substrates and flow changes
Invertebrate Data • 3 min kick sample • Count how many families present in river = Number of Taxa
Invertebrate Data • 3 min kick sample • Count how many families present in river = Number of Taxa • Calculate the BMWP (Biological Monitoring Working Party) score
These scores are based on tolerance to organic pollution Mayfly - Heptageniidae least tolerant (more likely to die) Worm - Oligochaeta most tolerant – unlikely to die (10x6)+ (7x4)+ 6 + (5x3) + 4 + 1 = 114
Invertebrate Data • 3 min kick sample • Count how many families present in river = Number of Taxa • Calculate the BMWP (Biological Monitoring Working Party) score • Calculate the ASPT (Average Score per Taxon)= BMWP Score/Number of TAXA
Invertebrate Data • 3 min kick sample • Count how many families present in river = Number of Taxa • Calculate the BMWP (Biological Monitoring Working Party) score • Calculate the ASPT (Average Score per Taxon)= BMWP Score/Number of TAXA • Compare our scores against expected scores where no pollution existed (output from RIVPACS)
Invertebrate Results • Site Taxa ÷ Expected Taxa= EQI Taxa 16 ÷ 21 = 0.76 • Site ASPT÷ Expected ASPT= EQI ASPT 7.13 ÷ 6.58 = 1.08
Invertebrate Results • EQI Taxa = 0.76 • EQI ASPT = 1.08 Use lowest score Site = A2 Good
Fisheries Data • 3 Run Depletion Fishing • Fish a measured area of river • Calculate a minimum estimate of fish density per 100m2
Fisheries Results • Number of Trout Caught -23 • Area Fished (m2) - 114 • Brown Trout minimum estimate density per 100m2 =20 • Fry found at site – no • 19 fish had black tails
What is good habitat? • Good Bankside and instream cover for fish to hide in • Holds banking together to prevent erosion • Water depth – not too shallow or deep
What is good habitat? • Changes in flow type • Meandering nature
What is good habitat? • Not all rivers are the same shape….upland rivers that are steep tend to be straighter and full of boulders and large cobbles.
What next? • Examine your site results • Compare with a ‘perfect’ river • How is your site different? • How could it be improved? • Can it be improved? • Do you need to work with pupils from other classes? • Check out the website where all of the information for the field results can be found. • Use Kidblog to talk to each other and ask questions • Email • Internet
Presentation • A group from each site will present their findings to us • Looking for you to highlight the biggest problems faced at your site. • Date to be confirmed...June 2014.