Download
1 / 35
350 likes | 468 Vues
Trends in Higher Education Pricing & Student Aid October 11, 2011. Al Hermsen Paul Schroeder Sr. Director – Student Financial Aid Sr. Educational Manager Wayne State University College Board Midwestern Regional Office . Agenda. Interactive conversation

E N D
Trends in Higher Education Pricing & Student AidOctober 11, 2011 Al Hermsen Paul Schroeder Sr. Director – Student Financial Aid Sr. Educational Manager Wayne State University College Board Midwestern Regional Office
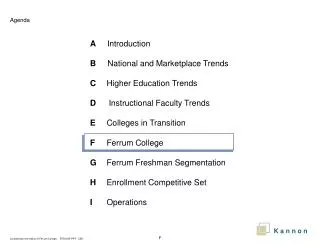
Agenda • Interactive conversation • Walkthrough of “Trends” web-site • Goal: Familiarize you with web-site/useful tool • Why use “Trends” information? • Tour “Trends in College Pricing” web-site • Prices – Published, variation, net • Institutional finances • Enrollment and income
Agenda (page 2) • Tour “Trends in Student Aid” • Types of Student Aid • Sources of Grand Aid • Distribution of Student Aid • Student Borrowing
SOURCE: The College Board, Trends in College Pricing 2010, Figure 1. Average Estimated Undergraduate Budgets, 2010-11 (Enrollment-Weighted)
SOURCE: The College Board, Trends in College Pricing 2010, Table 1A.
SOURCE: The College Board, Trends in College Pricing 2010, Table 1B.
SOURCE: The College Board, Trends in College Pricing, Figure 4 Average Annual Percentage Increases in Inflation-Adjusted Published Prices by Decade, 1980-81 to 2010-11
SOURCE: The College Board, Trends in College Pricing 2010, Figure 6. Public Two-Year Colleges Average Tuition and Fee and Room and Board (TFRB) Charges by College Board Region, in Constant 2010 Dollars, 2000-01 and 2010-11 (Enrollment-Weighted)
SOURCE: The College Board, Trends in College Pricing 2010, Figure 6. Public Four-Year Colleges and UniversitiesAverage Tuition and Fee and Room and Board (TFRB) Charges by College Board Region,in Constant 2010 Dollars, 2000-01 and 2010-11 (Enrollment-Weighted)
SOURCE: The College Board, Trends in College Pricing 2010, Figure 6. Private Nonprofit Four-Year Colleges and UniversitiesAverage Tuition and Fee and Room and Board (TFRB) Charges by College Board Region in Constant 2010 Dollars, 2000-01 and 2010-11 (Enrollment-Weighted)
Note: Financial aid values for 2010-11 are estimated based on earlier years. SOURCE: The College Board, Trends in College Pricing 2010, Figure 7. Published Tuition and Fees, Net Tuition and Fees, and Room and Board in Constant 2010 Dollars, Full-Time Undergraduate Students, 1995-96, 2000-01, 2005-06 and 2010-11
SOURCE: The College Board, Trends in College Pricing 2010, Figure 8B. Net Price: Public Two-Year CollegesFull-Time Students by Dependency Status and Family Income, 2007-08
SOURCE: The College Board, Trends in College Pricing 2010, Figure 11A. Mean and Median State Appropriations for Higher Education per $1,000 in Personal Income, 1989-90 to 2009-10
SOURCE: The College Board, Trends in College Pricing 2010, Figure 11B. State Appropriations for Higher Education per $1,000 in Personal Income by State, 2009-10 (including Federal Stimulus Funds)
SOURCE: The College Board, Trends in College Pricing 2010, Figure 12B. Net Tuition Revenue per Full-Time Equivalent (FTE) Student by Carnegie Classification, 2002–2008in Constant 2008 Dollars
SOURCE: The College Board, Trends in College Pricing 2010, Figure 13. Educational Expenditures per Full-Time Equivalent Student by Carnegie Classification, 2002–2008, Selected Years in Constant 2008 Dollars
SOURCE: The College Board, Trends in College Pricing 2010, Figure 16A. Percentage Growth in Mean Family Income by Quintile in Constant 2009 Dollars, 1979–1989, 1989–1999, and 1999–2009
SOURCE: The College Board, Trends in College Pricing 2010, Figure 16B. Median Family Income by Selected Characteristics, 2009
SOURCE: The College Board, Trends in Student Aid 2010, Figure 1. Ten-Year Trend in Student Aid and Nonfederal Loans per FTE Used to Finance Postsecondary Education Expenses in Constant 2009 Dollars, 1999-2000 to 2009-10
SOURCE: The College Board, Trends in Student Aid 2010, Figure 2A. Undergraduate Student Aid by Source (in Billions), 2009-10
SOURCE: The College Board, Trends in Student Aid 2010, Figure 2B. Graduate Student Aid by Source (in Billions), 2009-10
SOURCE: The College Board, Trends in Student Aid 2010, Figure 8A. Grants and Loans as a Percentage of Funds from Total Aid and Nonfederal Loans Undergraduate Students, 1994-95 to 2009-10
SOURCE: The College Board, Trends in Student Aid 2010, Figure 8B. Grants and Loans as a Percentage of Funds from Total Aid and Nonfederal Loans Graduate Students, 1994-95 to 2009-10
SOURCE: The College Board, Trends in Student Aid 2010, Figure 10A. Average Student Debt per Borrower andAverage Student Debt per GraduatePublic Four-Year Bachelor’s Degree Recipients1999-2000 to 2008-09 (in Constant 2009 dollars)
SOURCE: The College Board, Trends in Student Aid 2010, Figure 10B. Average Student Debt per Borrower andAverage Student Debt per GraduatePrivate Four-Year Bachelor’s Degree Recipients1999-2000 to 2008-09 (in Constant 2009 dollars)
SOURCE: The College Board, Trends in Student Aid 2010, Figure 11A. Average Aid per Undergraduate FTE, 1994-95 to 2009-10 in Constant 2009 Dollars
SOURCE: The College Board, Trends in Student Aid 2010, Figure 11B. Average Aid per Graduate FTE, 1994-95 to 2009-10 in Constant 2009 Dollars
SOURCE: The College Board, Trends in Student Aid 2010, Figure 13B. Maximum Pell Grant as a Percentage of Tuition and Fees and Room and Board (TFRB), 1990-91 to 2010-11
SOURCE: The College Board, Trends in Student Aid 2010, Figure 14A. Percentage Distribution of Pell Grant Recipients by Family Income and Dependency Status, 2008-09
SOURCE: The College Board, Trends in Student Aid 2010, Figure 14B. Percentage Distribution of Pell Grant Recipients by Age, 2008-09
SOURCE: The College Board, Trends in Student Aid 2010, Figure 16. State Grant Dollars per Full-Time In-State Undergraduate Student and Percentage Receiving State Grants, by Dependency Status and Income, Selected States, 2007‑08
“Trends” web-site For more information, visit:trends.collegeboard.org
Contact Information Al Hermsen Senior Director – Student Financial Aid Wayne State University AHermsen@wayne.edu 313-577-4982 Paul Schroeder Senior Educational Manager College Board PSchroeder@collegeboard.org 847-653-4504