Download
1 / 21
210 likes | 334 Vues
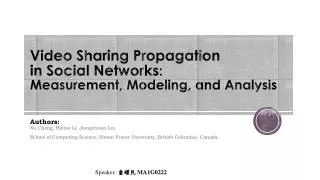
A Measurement-driven Analysis of Information Propagation in the Flickr Social Network. Meeyoung Cha Alan Mislove Krishna P. Gummadi. Main content. What to research Measurement methodology Results Discussion Conclusion. What to research.

E N D
A Measurement-driven Analysis of Information Propagation in the Flickr Social Network Meeyoung Cha Alan Mislove Krishna P. Gummadi
Main content • What to research • Measurement methodology • Results • Discussion • Conclusion
What to research • Characteristics of information propagation in social network (in this paper, Flickr). i.e., to answer three key questions: • How widely does information spread in the Flickr? • How quickly does information spread in the Flickr? • What fraction of a photo’s fans discovered the photo through a friend (social link)?
Measurement methodology • Start with a randomly selected Flickr user and follow all of the friends links in the forward direction in a breadth first search fashion. (→Flickr social network graph) • Launch a complete crawl of the social network graph once per day for the period of 104 consecutive days. (→ capture the dynamics of friends’ relationships.)
Results • High content locality Method: randomly picked 250 users (or seed nodes) from the set of 2.5 million users who have favorite-marked at least one photo, and identified the top 100 pictures from the neighborhood of each seed node. We visited the 4-hop neighborhood around each of these seed nodes, based on the final snapshot of the network.
Then they compared every locally popular top 100 pictures with the globally popular top 100 pictures, and determine the number of photos that appear in both lists, the “overlap.” Result: different pieces of information are popular among the different social network regions.
Figure 5 shows a steady linear growth pattern for the most popular pictures. while the existing models of information diffusion predict an exponential growth in popularity.
Result 1: Table 5 reveals that social cascade plays a significant role in propagating information for both popular and unpopular pictures, and that uploaders play a crucial role in the social cascades of less popular pictures.
Result 2: The probability of a user becoming a fan of a photo increases with the number of her friends who are already fans of the photo. That is, the behavior of favorite marking is influenced by peers in the social network.
Result 3: Favorite marking information takes a long time to spread across each link in the social network.
Discussion • High content locality viral marketing model: where N is the number of initial seeds. and The expected number of new infectious generated by each infected person is called the reproduction rate or R. If R> 1, each person is infecting more than one additional person and the number of infected people will grow exponentially, i.e., viral marketing is a success. When R< 1, initial seeds will quickly burn themselves out after several steps of information spreading.
In Flickr, the uploader is often the only seed who actively advertises a photo (i.e., R> 1), and the characteristics of R may change drastically beyond the immediate neighborhood of the uploader (i.e., R <<1). This may explain high content locality near the uploaders.
Why did the top popular photos take a long time to propagate from one friend to another ? In Flickr, users get a small number of updates about their friends’ newly uploaded pictures when they log in. So the rate of information propagation may be limited by the frequency of user logins
Conclusion They showed empirical evidence that (a) social links are the dominant method of information propagation, accounting for more than 50% of the spread of favorite-marked pictures; (b) information spreading is limited to individuals who are within close proximity of the uploaders; and (c) spreading takes a long time at each hop. As a result, they found that content popularity is often localized in the network and popularity of pictures steadily increases over many years.