Download

1 / 14
140 likes | 288 Vues
Correlation Coefficient : Just how strong is this relationship?. AP Statistics Newell. Carbs vs. Fat. Here are data on 9 different types of hamburgers at McDonalds. Carbs vs. Fat. Are we looking for an explanatory-response relationship or just a relationship here?

E N D
Correlation Coefficient: Just how strong is this relationship? AP Statistics Newell
Carbs vs. Fat Here are data on 9 different types of hamburgers at McDonalds.
Carbs vs. Fat • Are we looking for an explanatory-response relationship or just a relationship here? • What relationship do you expect? • Enter carbs into L1 and fat into L2. Create the scatterplot. • Describe the strength, form, and direction of the scatterplot. Are there any outliers?
Correlation • A correlation is a LINEAR relationship. • The correlation coefficient is a number that summarizes how strong the LINEARrelationship is as well as the direction of that LINEAR relationship. • Correlation = LINEAR relationship
Fun facts about the correlation coefficient • A measure of the strength and direction of a LINEAR relationship • r or R (as a statistic, as a parameter use r or rho) • -1 ≤ r ≤ 1 • Negative r = negatively sloping line • Positive r = positively sloping line • r = 1 or -1 perfect linear relationship • r = 0 no linear relationship • r has no units… we’ll see why in a minute
Carbs vs. Fat • Is the correlation coefficient positive or negative here? • Is the correlation coefficient closer to 1 or to 0? • Let’s find this on our calculators…
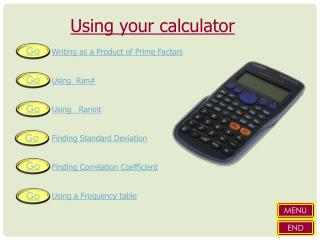
Calculator Instructions • Before we begin, turn diagnostics on 2nd CATALOG DiagnosticOn ENTER • Enter data into two lists • Go to: STAT CALC 8: LinReg(a+bx) ENTER • Enter your two lists, separated by a comma. The explanatory variable should be first.
Examples… Match R to each picture • r = -.9668 • r = .8621 • r = -.8984 • r = .1990
What happens to r when the data changes? • Add 20 to each explanatory value Put cursor on name L3. 2nd 1 + 20 Enter • Find the correlation between L3 and L2 (L3 is the explanatory variable)
What happens to r when the data changes? • Multiply each explanatory value by 5 Put cursor on name L3. 2nd 1 *5 Enter • Find the correlation between L3 and L2 (L3 is the explanatory variable)
What happens to r when the data changes? • Find the correlation between L1 and L2 where L2 is now the explanatory variable.
What happens to r when the data changes? R does NOT change if • You change one variable’s values by adding or multiplying the same number to each value • You switch the explanatory and response variables