Download
1 / 23
230 likes | 313 Vues
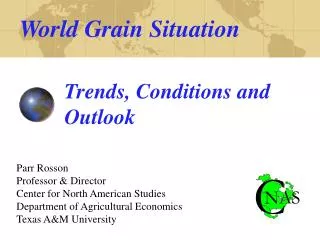
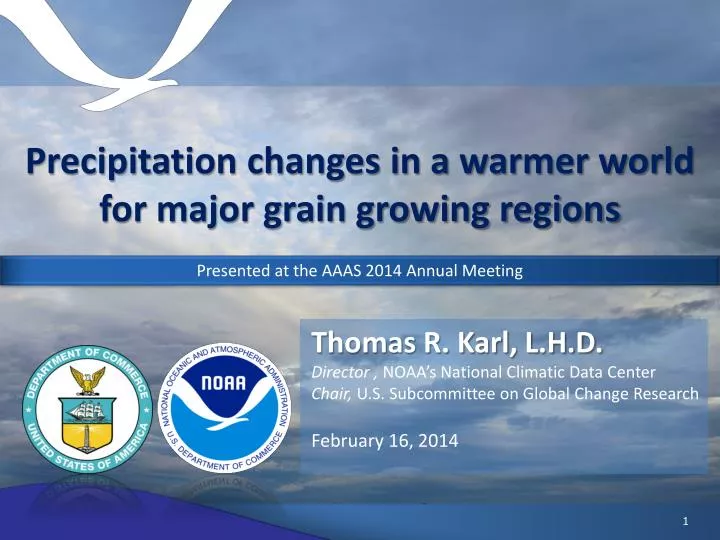
Precipitation changes in a warmer world for major grain growing regions. Presented at the AAAS 2014 Annual Meeting. Thomas R. Karl, L.H.D. Director , NOAA’s National Climatic Data Center Chair, U.S. Subcommittee on Global Change Research February 16, 2014. Introduction.

E N D
Precipitation changes in a warmer world for major grain growing regions Presented at the AAAS 2014 Annual Meeting Thomas R. Karl, L.H.D. Director , NOAA’s National Climatic Data Center Chair, U.S. Subcommittee on Global Change Research February 16, 2014
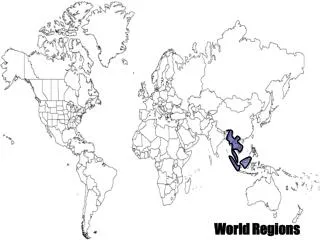
Introduction • Major grain growing regions • Climate variables affecting agriculture • Drought & heat • Growing season • Mean precipitation • Soil moisture • Extreme precipitation • Erosion
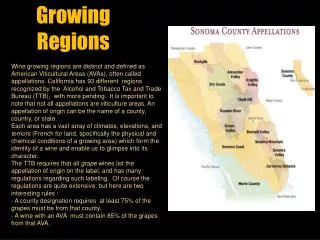
Extent of cropland Food and Agriculture Organization (FAO) of the United Nations, 2006
Climate Variables Affecting Agriculture • Change by 2100 under the A2 (higher emissions) scenario. • Hot nights = minimum temp warmer than 90% of minimums between 1971-1990 National Climate Assessment, Draft for public comment 2013
U.S. Heat and Drought of 2012 Illinois From MODIS data. Courtesy of I. Becker-Reshef, E. Vermote, M. Claverieand C. Justice, University of Maryland. Karl et al, Eos, 2012
Observed Water Cycle Change • Saturation vapor pressure of air increases with temperature • Observed global change in water vapor of about 3.5% in the past 40 years is consistent with the observed temperature change of about 0.5C during the same period • Water vapor change attributed to human influence with medium confidence IPCC WGI Fifth Assessment Report, 2013
Projected Water Cycle Change • 2081–2100 relative to 1986–2005 under the RCP8.5 scenario • Global-scale precipitation expected to increase gradually (~2% per Kelvin) • Water vapor increase ~7% per Kelvin • High latitudes likely to experience greater precipitation due to additional water carrying capacity of warmer atmosphere • Many mid-latitude and semi-arid regions likely experience less IPCC WGI Fifth Assessment Report, 2013
Projected Precipitation Change By Season • Projected percent change in seasonal precipitation for 2070-2099 (compared to the period 1901-1960) under higher emissions (A2) scenario National Climate Assessment, Draft for public comment 2013
Extreme precipitation and erosion Soil and Water Conservation Society, 2003
IPCC 2013Heavy Precipitation Events IPCC WGI Fifth Assessment Report, 2013
Observed Global Trends in Heavy Precipitation Annual Amount of Precipitation from Days >95th Percentile 1951-2010 Daily Precipitation Intensity 1951-2010 IPCC WGI Fifth Assessment Report, 2013
Observed U.S. Trends in Heavy Precipitation “Events” • Once-in-five-year 2-day total • Changes are compared to the period 1901-1960 and do not include Alaska or Hawaii. • The 2000s decade (far right bar) includes 2001-2011 National Climate Assessment, Draft for public comment 2013
Observed U.S. Trends in Very Heavy Daily Precipitation Events (Heaviest 1%) 1958-2011 National Climate Assessment, Draft for public comment 2013
Observed Precipitable Water Difference1990-2009 minus 1971-1989 for daily, 1-in-5-year extreme events NOAA/NCDC
Observed Heavy downpours in Iowa • Days with more than 1.25 inches of rain. • Top corn and soybean producing state. Downpours can • Delay planting • Reduce crop productivity • Cause erosion and loss of soil nutrients • How much rain is too much? National Climate Assessment, Draft for public comment 2013
Observed Consecutive Dry Days • Frequency of the annual maximum number of consecutive dry days • Black plus signs (+) indicate grid boxes where trends are significant IPCC WGI Fifth Assessment Report, 2013
Future Return Period for Present Day Wettest Day in 20 years • 2081-2100 compared to 1986-2005 • RCP8.5 IPCC WGI Fifth Assessment Report, 2013
Projected Future Trends in Extreme Precipitation Potential Maximum Precipitation • Potential Maximum Precipitation likely to increase with increases in atmospheric water vapor due to warming oceans and increased evaporation Change in Precipitation Intensity Adjusted for future water vapor trends Adjusted for recent water vapor trends Currently used in PMP NOAA/NCDC NOAA/NCDC
Summary • Changes in drought and heat, with attendant feedbacks, are likely to affect growing conditions • Major grain growing regions expected to experience shifts in mean precipitation patterns and soil moisture • Extreme precipitation has been observed to be increasing, and is expected to increase further in intensity and frequency • Expected impacts on erosion and runoff