Download
1 / 37
370 likes | 523 Vues
Thinking about the Arctic Oscillation. Richard B. Rood University of Michigan for the National Park Service August 8, 2013. Outline. Why am I giving this talk? Some aspects of climate variability The Arctic Oscillation A heuristic: vortices The Arctic Oscillation and Climate Change

E N D
Thinking about the Arctic Oscillation Richard B. Rood University of Michigan for the National Park Service August 8, 2013
Outline • Why am I giving this talk? • Some aspects of climate variability • The Arctic Oscillation • A heuristic: vortices • The Arctic Oscillation and Climate Change • Synthesis • Big Thanks to Jim Hurrell for consultation and some slides. • This talk and backup material at GLISAclimate.org
Why am I giving this talk? • Worked on an adaptation planning activity with Isle Royale Park • The Arctic Oscillation emerged as an important weather-climate driver • The Arctic Oscillation has major impact on warm-cold, dry-wet, especially in winter and spring in the eastern half of North America • The response of ecosystems to this variability can amplify the weather-climate variability • Will the behavior of the Arctic Oscillation change?
Some Aspects of Climate Variability • One of the ways to think about climate variability is to think about persistent patterns of weather • Rainy periods • Floods • Dry periods • Droughts • During these times the weather for a region does not appear random – it perhaps appears relentless
An example of variability: Seasons Warm Cold Cold Temperature Messy Messy Winter Summer Winter Rain comes in thunderstorms Rain comes in fronts Forced variability responding to solar heating
Internal Variability(Rood Class Lecture 2010) • Weather – single “events” – waves, vortices • There are modes of internal variability in the climate system which have global consequences. • El Nino – La Nina • What is El Nino • North Atlantic Oscillation / Arctic Oscillation • Climate Prediction Center: North Atlantic Oscillation • Annular Mode • Inter-decadal Tropical Atlantic • Pacific Decadal Oscillation
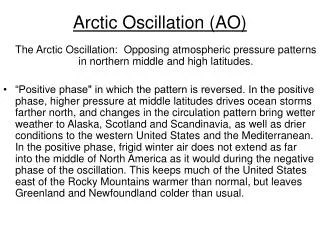
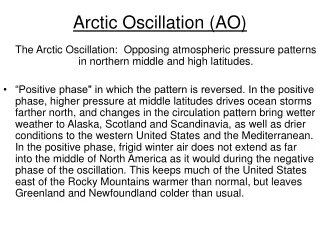
Definition: CPC Climate Glossary Arctic Oscillation (AO) - The Arctic Oscillation is a pattern in which atmospheric pressure at polar and middle latitudes fluctuates between negative and positive phases. The negative phase brings higher-than-normal pressure over the polar region and lower-than-normal pressure at about 45 degrees north latitude. The negative phase allows cold air to plunge into the Midwestern United States and western Europe, and storms bring rain to the Mediterranean. The positive phase brings the opposite conditions, steering ocean storms farther north and bringing wetter weather to Alaska, Scotland and Scandinavia and drier conditions to areas such as California, Spain and the Middle East. The North Atlantic Oscillation is often considered to be a regional manifestation of the AO.
Some Attributes of Arctic Oscillation • For our discussion Arctic Oscillation, North Atlantic Oscillation, and Northern Annular Mode are related – essentially the same • Largest mode of variability in northern middle and high latitudes • It is present all year, we notice it more in winter and spring • El Nino – La Nina Arctic Oscillation • Ocean – Atmosphere • Global Influence • Predictable • Atmosphere • Strong Regional Influence • Difficult to predict
Year-to-Year Changes in Winter Temperatures Differences Relative to 1961-1990 Average Late 1970s 2006-2011 From Jim Hurrell
Winter (Dec-Feb) Surface Temperature Differences Relative to 1961-1990 Average (32.6ºF) United States (lower 48) • Lots of variability including very large changes from one winter to the next • Winter of 1979 was the coldest in the US record (5.3ºF below average) • Most winters since 1985 have been warm; colder winters early in the record • February 1985 was the last month below twentieth century average • Contiguous US winter temperatures have warmed ~2ºF since 1895 • Winter of 2010 was 15th coldest since 1895 (1.4ºF below average), • while winter 2011 was the 39th coldest (0.35ºF below average). From Jim Hurrell
Arctic Oscillation 1895 – 2011 Daily Index Period used in Previous Maps 2010 2011
Side by Side ComparisonArctic Oscillation and North American Temperature DJF Temperature: Anomaly 1961-91 From Jim Hurrell
Some basic references • Hurrell, 1995: Decadal trends in the North Atlantic Oscillation: Regional Temperature and Precipitation • Hurrell and Deser, 2010: North Atlantic climate variability: The role of the North Atlantic Oscillation • Kuzmina et al. 2005: The North Atlantic Oscillation and Greenhouse Gas Forcing • Bai et al., 2012: Great Lakes ice and Arctic Oscillation and El Nino
What’s going on? A heuristic • A conceptual physics-based foundation • A vortex is circulating air. • If there is a low pressure system on Earth in the northern hemisphere then air circulates counterclockwise around the low.
Heuristic: A vortex fast Low http://commons.wikimedia.org/wiki/File:Rotational_vortex.gif
Heuristic: A vortex and a ball fast Try to roll the ball towards the vortex Low http://commons.wikimedia.org/wiki/File:Rotational_vortex.gif http://i206.photobucket.com/albums/bb194/Dantejfisher/RollingBall.gif
Heuristic: A vortex and a ball fast Try to roll the ball towards the vortex Low • Vortices are boundaries or separators. • Air inside of vortices often takes on distinct characteristics. http://commons.wikimedia.org/wiki/File:Rotational_vortex.gif http://i206.photobucket.com/albums/bb194/Dantejfisher/RollingBall.gif
Ball rolling experiment Ball roller and friend http://24.media.tumblr.com/tumblr_m3q2hkeyJV1r3a6jho1_500.gif
Cold vortex Imagine air isolated over the pole in winter, with no sun.
Cold vortex surrounded by warm air Cold at y y X Warm at x
Strong vortex and weak vortex STRONG WEAK
Weak vortex surrounded by warm air Warm at y y X Cold at x Concept of Blocking
The Arctic Oscillation “Positive” Phase “Negative” Phase • Strong low (high) air pressure • at high (middle) latitudes • Pressure systems weaker • Extremely cold air confined • to Arctic • Cold Arctic air spills into • middle latitudes • Warm middle latitudes • Warm middle latitude air • moves into Arctic Strong vortex Weak vortex From Jim Hurrell
Year-to-Year Changes in Winter Temperatures Differences Relative to 1961-1990 Average Late 1970s 2006-2011 From Jim Hurrell
What Climate Processes Govern NAO Variability? • 200 years of NCAR CAM without • variations in “external”forcings • Basic structure & time scale arises • from internal nonlinear atmospheric • dynamics EOF1 SLP (Dec-Mar) Observed Simulated NAO Index Simulated (Dec-Mar) Random and Unpredictable Variations Random and Unpredictable Variations r (1yr) = -0.07 Observed Except for the latter half of the 20thcentury r (1yr) = -0.03 r (1yr) = 0.4 A role for external forcing?
What’s the future? • The indication from model simulations prior to 2012 are that the positive phase of the Arctic Oscillation will become more prominent … • But … these models don’t have the loss of sea ice and northern snow cover … • Huge changes in the forcing of the atmosphere • Radiative forcing due to change in color • Heat flux between ocean and atmosphere • Heat flux between land and atmosphere • Moisture flux between ocean-land-atmosphere
And in the end what might really matter – how storms propagate • Edge of the vortex • Strength of storms • Direction of storms • Speed of storms Warm at y y X Cold at x
North Atlantic Oscillation(from Lamont-Doherty ) Negative Phase U.S. East, Cold Air Outbreaks, Snow (dry) Europe North, Cold; South, Wet Greenland, Warm Positive Phase U.S. East, Mild and Wet Europe North, Warm and Wet Canada North & Greenland, Cold and Dry
Some recent research • Liu et al., 2012: Impact of declining Arctic sea ice on recent winter snow fall “ some resemblance to the negative phase of the winter Arctic oscillation. However, the atmospheric circulation change linked to the reduction of sea ice shows much broader meridional meanders in midlatitudes and clearly different interannual variability than the classical Arctic oscillation.”
Some recent research • Francis and Vavrus, 2012: Evidence linking Arctic amplification to extreme weather in mid-latitudes “Slower progression of upper-level waves would cause associated weather patterns in mid-latitudes to be more persistent, which may lead to an increased probability of extreme weather events that result from prolonged conditions, such as drought, flooding, cold spells, and heat waves.”
Some recent research • Greene et al., 2013: Superstorm Sandy: A series of unfortunate events? “However, there is increasing evidence that the loss of summertime Arctic sea ice due to greenhouse warming stacks the deck in favor of (1) larger amplitude meanders in the jet stream, (2) more frequent invasions of Arctic air masses into the middle latitudes, and (3) more frequent blocking events of the kind that steered Sandy to the west”
Some synthesis • We are seeing, here, an instance of the “non-stationarity” of climate. • Change in the surface, changes energy and moisture characteristics of weather • The statistical distribution will change • This is not a simple shift of the distribution function • Evidence that the variability will increase • But, remember, we are in warming climate • Changes in regional and seasonal heat and moisture budget • Heavy snow, fast melt, change of water supply and quality, winter and spring flooding • Propagation of storms is likely to change to cause the accumulation of weather effects into more extreme events • Slow moving storms are very good at, for instance, building up storm surges • Sustained precipitation followed by sustained heat and dry • If I were a planner, then I would be expecting more variability with increasing extremes associated with storms surges, heat, air quality, drought and flood
Some Ecological References • Walther et al., 2002: Ecological responses to climate change • Post et al., 2009: Population dynamics and hot spots of response to climate change • Hurrell and Deser, 2010: North Atlantic Climate Variability (reference to other literature)
GLISAclimate.org • Big Thanks to Jim Hurrell for consultation and some slides. • Material and more in project on Arctic Oscillation at GLISAclimate.org . Please join project, write comments, re-use material, correct mistakes, ask questions, and add more. • http://glisaclimate.org/project/arctic-oscillation%3A-climate-variability-in-great-lakes