Download
1 / 31
310 likes | 374 Vues
Elida Board Of Education Meeting. Superintendent's Report March 19, 2013. Superintendent’s Report. Pay-To-Participate – Schedule H.S. $200.00, M.S. $125.00 Family Plan for H.S. $200.00 first, $150.00 second, $100.00 third, fourth, etc. Middle School Sports

E N D
Elida Board Of Education Meeting • Superintendent's Report • March 19, 2013
Superintendent’s Report • Pay-To-Participate – Schedule • H.S. $200.00, M.S. $125.00 • Family Plan for H.S. $200.00 first, • $150.00 second, $100.00 third, fourth, etc. • Middle School Sports • Family Plan for M.S. $125.00 first, • $100.00 second, $75.00 third, fourth, etc.
P-2-P Continued • H.S. Band (only) $50.00 • Jazz Band $0.00 • M.S. Band $0.00 • Musical only • H.S. $40.00 • M.S. & Elementary. $25.00 • Family Plan • $40.00 first, 10.00 second, third, etc.
P-2-P Continued • H.S. Quiz Bowl (9–12) only $40.00 • M.S. Quiz Bowl (5–8) only $20.00 • National Honor Society $0.00 • H.S. Student Council $0.00 • M.S. Student Council $0.00
Let’s Review a couple of Numbers • Total expense per pupil: • $8,150 - rank 564 out of 609 • Only 45 districts spend less • Administrative cost per pupil: • $893 - rank 556 out of 609 • Only 53 districts spend less • Administrative cost per pupil: • Lowest in the County 3 years in a row • 20th of 21 Districts in our State Group
A Death by a Thousand Cuts • 2009-10 $323,444 • 2010-11 $191,000 • 2011-12 $1,282,000 • 2012-13 $590,000 • 2013-14 $465,569 • Total $2,841,044
What is Left to Cut? • What are the State Minimum Standards? • So what does it mean when I say… “I don’t know what else we can cut?”
Regular Student Population • Total ADM 2,525.63 • Open Enrollment (In) + 263.48 2,789.11 • Open Enrollment (Out) - 263.65 2,525.46 • Special Education - 160.80 2,364.66
Regular Student Population 2,364.66 • Community School - 106.59 2,258.07 • Post Secondary - 6.70 2,251.37 • JVSD 20% - 27.76 Regular Student Population 2,223.61
State Minimum Standards • State Minimum Standard student to teacher ration is 1 –25 • 2,223.61 ÷ 25 = 88.94 teachers • We have 103.32, 14.38 over SMS
So the question becomes:Where can we cut 14.5 teachers? #/Sect. RatioMax. Cut • K 201÷9 22.3-1 22-1 Over • 1 186÷8 23.2-1 24-1 No • 2 209÷9 23.2-1 24-1 No • 3 184÷8 23.0-1 24-1 No • 4 187÷8 23.3-1 24-1 No
So the question becomes:Where can we cut 14.5 teachers? #/Sect. RatioMax. Cut • 5 219÷8 27.4-1 24-1 Over • 6 168÷7 24.0-1 27-1 No • 7 220÷8 27.5 27-1 Over • 8 200÷ 8 25.0-1 27-1 No
So the question becomes:Where can we cut 14.5 teachers? #/Sect. RatioMax. Cut • 9 207 • 10 175 • 11 171(41) • 12 146(38) 699(5x6=30) = 23.3 699(6x6=36) = 19.5
So the questions becomes:Where can we cut 14.5 teachers? • H.S. Language Arts 1 $50,000 • H.S. Science 1 $50,000 • H.S. Foreign Language 1 $50,000 • M.S. Foreign Language 1 $50,000 • H.S. Computers/Tutor 1 $50.000 • Elem. Building Coach 1 $50,000 • Kindergarten 5$250,000 10 $550,000
Educational Service Personnel • Counselor 3 • Media Specialist 0.5 • School Nurse 1 • Visiting Teacher 0 • Social Worker 1 • Elementary Art (K-8) 3 • Elementary Music (K-8) 4.5 • Elementary PE (K-8) 4 17
Extra Curricular Activities • $485,000 • Salaries • Benefits • Athletic Director • Athletic Secretary
So, what is on the cut list? • All day every day kindergarten, and extra curricular activities? • Middle School Language or Music? • High School Science, English or Foreign Language Teacher? • Is there even a choice?
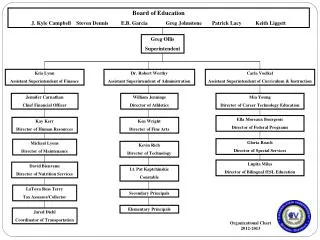
So what about administrators? • SMS – Every school must have the services of a principal. Every school with 15 teachers shall have the services of a full time principal.
So what about administrators?15 – 1 Ratio • What does 153+316+555 = More U.M. • High School (2 administrators) • 40 teachers: 20-1 ratio • Middle School (2 administrators) • 49 teachers: 24.5-1 ratio • Elementary School (2 administrators) • 55 teachers: 27.5-1 ratio
TransportationCuts not on the table? • We are not required to provide transportation for students 9-12 • Still running the same areas and have over 700 less riders – Lose $25,000 • Closing Gomer cost us about $25,000 • K-12, 2 mile walk zone $75,000 • 2 mile walk zone HS only $25,000
Without the levyCarryover Balance: • Counting the Governors $774,000 • 2012-13 $1,503,142 • 2013-14 $1,194,297 • 2014-15 $ 138,946 Without the Governors Proposal? 2012-13 $1,503,142 2013-14 $420,297 2014-15 -$590,054
How do we cut $1,000,000 • Core Teachers $363,000 • Non-Core $218,750 • Athletics $485,000 • Cut List $1,066,750
What additional costs are out there? • New Charter School(s) • Center for Autism and Dyslexia • Additional ESC Costs • Health Care • Staffing for 3rd Grade Guarantee • Additional staff for evaluation?
Extra Curricular Activities • Reduce number of activities • Fall • Football – Volleyball / B&G Soccer • Winter • Boys and Girls Basketball • Spring • B & G Track, Softball, Baseball
Extra Curricular Activities • Other cuts • Middle School Sports • Musical • Student Council • Quiz Bowl Teams
Extra Curricular Activities • Cuts • Fall • X-Country, Golf, Girls Tennis • Winter • Wrestling • Spring • Boys Tennis
What about Transportation? • Transportation Supervisor • Reduced miles traveled, fuel consumption, man hours • $1 million dollar a year operation • We travel 299,377 miles in FY12 • Down from 403,654 miles in 2002 • 83,123 gal. 2001 - 51,598 gal. 2012 • Man hours 2001 in 134 in 2012 in 94
Transportation Costs Increase • Bus Replacement • 18 year plan, 1.5 per year • In 2002 we received $48,000 reimbursement on a $56,000 bus. • Today we receive $0.0 reimbursement on an $88,000 bus (367% increase). • Fuel 2001 $0.86 2012 $350.00
Transportation • Bus Fleet • 2002 – 36 busses, 34 on daily runs • 2012 – 28 buses, 22 on daily runs • 2002 – 403,654 miles – 2,293 per day • 2012 – 299,377 miles – 1,701 per day
Transportation • District 68 square miles, 66% in 14 sq. miles. • 22% of students live in the Laurel Oaks, Lobo and Village (6 sq. miles). • 44% of students live in Edgewood, Sherwood, and Northland areas (8 sq. miles). • Remaining 33% live in 54 sq. miles
TransportationWhat about outsourcing? • “In terms of cost, union staff, your operation truly appears to be one of the best managed I have seen.” • “I find it difficult to recommend outsourcing and believe, on the contrary, a congratulations on a well run student transportation department is in order.” – Barry Bryan