Download
1 / 45
450 likes | 579 Vues
Laboratory 13 : Neurophysiology Dr. Craelius. Autonomic (Involuntary) and Somatic (Voluntary) Nervous Systems) Methodologies for measuring and controlling both.

E N D
Laboratory 13 : NeurophysiologyDr. Craelius • Autonomic (Involuntary) and Somatic (Voluntary) Nervous Systems) • Methodologies for measuring and controlling both. • Relevant to Neuroprostheses. I.e. how can we “decode” what the brain is telling our organs and muscles, so that when the information channels are blocked, we can replace them?
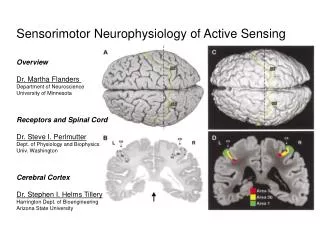
The output is a pulse train: Its frequency contains the information. In general the higher the frequency, the greater the information content. Neurons in the MI cortex are specialized for such operations As kinematics or dynamics.
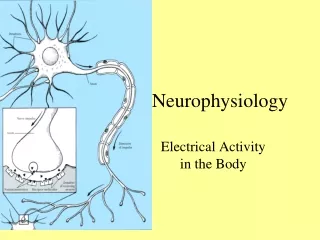
Neurophysiology Basics • Muscles and neurons are excitable, and carry information through their pulse rate. • I = log2(fm*t +1) • Action Potential - a reversal in relative polarity or change in electrical potential of a cell Neurotransmitters- chemical messengers • Central neurons are specialized for function.
ANS Background • Spectral analysis of HRV reveals 2 limbs of the ANS. • ULF (diurnal) HRV is predictive of cardiac performance. • HRV signatures using Cepstral Analysis (US patent 6,390,986). • HRV manipulation can improve asthma (Vaschillo, Lehrer et al, 2004). • Portable digital recorders of ECG facilitate analysis.
HRV Analysis Pyramid Inverse Problem
Autonomic Nervous System & Heart Rate Variability • Exerts effects on every organ, but the heart is the most “visible” organ we can examine. • Para slows it, Sympa speeds it. Pacemaker Para Sympa Beatmaker
What modulates HR? • SNS has a periodicity of ~ 20 seconds, and possibly others. • ANS has a periodicity = breathing rate, and possibly others. • Thoracic motions alone can modulate, and vagal nerve drive of respiration can contribute. • Thermoregulation, daily activities can modulate long periodicities.
Low and High Frequency variations in blood pressure Respiration controls HF
High RSA during sleep @ 11:30 PM RR RESP RR RESP Tachogram
RSA disappeared during sleep 11:30 PM 1:00 AM 13 breaths/min 13 b
Can HRV identify disease or specific individuals? • Age-related normal ranges of overall HRV = SDNN, are known and are predictive of survival after MI. • A brief record of HR can be a signature of an individual using HR vector cepstral methods *. *Curcie, D, Craelius W: Recognition of Individual Heart Rate Patterns with Cepstral Vectors, Biological Cybernetics, 77/2:103-109, 1997
Analyzing HRV • Collect sufficiently long , ‘clean’, epoch, I.e. need at least a few cycles of the rhythm- so for LF , get > 3 X 20 seconds. • First examine tachogram, edit artifacts. • Do time domain stats, ie, S.D. • Do spectral analysis if you have sufficient data, ie. Need several cycles to detect.
Cardiovascular Resonance • Vaschillo & Lehrer et. Al. • Get ANS into resonance by biofeedback. • Deep breathing at resonant rate is key. • Resonance can influence performance.
Time Domain Indices Task Force: Circulation 93:1043-1065, 1996.
Geometric Indices Task Force: Circulation 93:1043-1065, 1996
TINN analysis RR Interval histogram
Frequency Bands Power (ms2) Frequency (Hz)
Ratios • LF/HF : estimates sympathetic to parasympathetic activities • LF-tilt/HF-supine: a more specific estimate
Processing Pulse Record Unfiltered Pulses High Pass Filtered @ 0.2 Hz Baseline correction: If you filter too much, you differentiate.
Motion Control Volition + Load -(sensation) = error
Motor Regions for UL Index Finger Forearm Areas for placing electrodes Biceps
Bionic Approaches to Restoring Mobility • Mobility can be restored by several neuroprosthetic approaches *. 1.*Craelius,W.: "The Bionic Man: Restoring Mobility", Science, Vol 295, 1018-1021, 2002.
Brain-Machine/Computer Interfaces • Monkeys in Brooklyn moving arms in North Carolina, fast learning (Wessberg et al.) • Completely paralyzed persons moving cursors and robotic arms (Kennedy, PR, et el.) • Paraplegic with implanted SC chip using switches on walker (Rabischong)
Record Inside the brain ? • Need > 1000 Implanted electrodes • Hence need wireless control from external controller • Electrode biocompatibility and migration • But decoding volition from motoneurons is surprisingly easy: simple cumulative summation of firing rates (linear)
Volitional Degradation/Restoration • G = H · V ( G and V are column vectors) • G is the measured response • H is the degradation through the system • V is the volition • To Retrieve volition:
Linear filter is simplest And best decoder
How to measure performance of decoding? • How accurate is positioning of arm? • Euclidean distance: • Speed versus accuracy
Time As your need for attention Accuracy Speed/Accuracy Tradeoff How to quantify? Attention Accuracy
Measuring performance with Speed/Accuracy tradeoff : Specific targeting task 90° SAT Fitts
SAT test MT = a + blog2(2A/W) where • MT = average movement time = Time/# of hits • A = amplitude (distance) of movement between targets • W = width of the target • a = intercept • b = slope • log2(2A/W) == difficulty level
SAT graph Difficulty index
Protocol • Pulse recording 5 min --- file • SAT test 5 min ---- file • Deep Breathing w/pulse recording 5 min--- file. • SAT test 5 min ---- file • Pulse recording 5 min --- file • SAT test 5 min ---- file
Analysis • Prepare pulse files, with HP filtering if necessary. • Use RR interval program to get intervals- optimize for minimal artifacts. • Put RR & SAT data in Excel- analyze & graph. • If time, further analyze RR data with Log-a-Rhythm.