Download
1 / 75
750 likes | 755 Vues
Learn the tools, techniques, and theories of statistics to properly analyze your results in AP Biology. Become a real scientist and master statistics throughout the school year. Resources and support available.

E N D
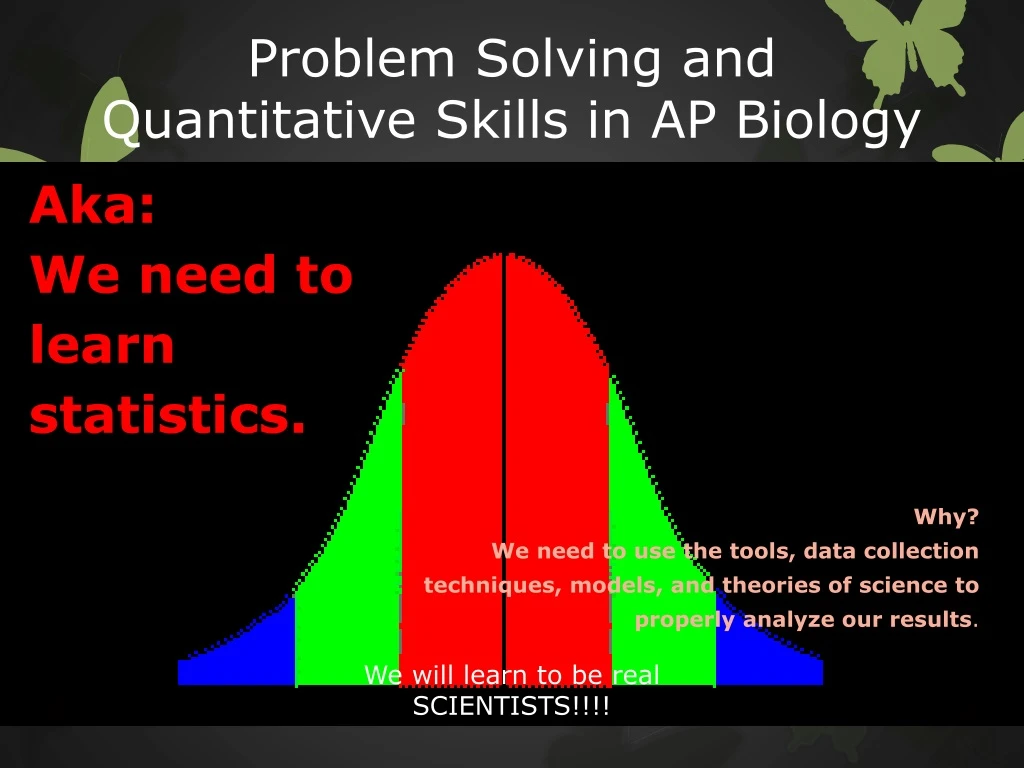
Problem Solving and Quantitative Skills in AP Biology Aka: We need to learn statistics. Why? We need to use the tools, data collection techniques, models, and theories of science to properly analyze our results. We will learn to be real SCIENTISTS!!!!
Up until now, there is strong possibility that you have you used the word hypothesis in only one way. • Now we have a null hypothesis that we either reject or fail to reject • And an alternate hypothesis that we reject or fail to reject.
Example: My null hypothesis at this point: There is no difference in the statistics skill level between members of our class that reviewed statistics during the summer and those that didn’t review. Now, if we come back to school and there is a significant difference we would state: Our null hypothesis has been rejected. GET IT??
If the dread of math is setting in, please know it will get better quickly and be open minded. After a little bit of struggle it really is not that bad. I have found all the tech tricks with graphs, etc, actually makes it kinda cool. • We will work on this during the entire school year during our investigation time. • This material, along with other supporting statistics resources will remain available to help you each time. We will build our expertise over time, this will not happen overnight.
It really makes things clear. You have probably asked yourself after many labs during your lifetime, “What did our results mean?”, “How do we know if it really has any meaning at all?”, “How could I test this to see if my experiment had any real meaning?”
Make some time for this!! • www.randi.org • www.badscience.net • MythBusters • Ted Talks “Battling Bad Science” • http://www.ted.com/talks/ben_goldacre_battling_bad_science
Vocabulary • http://www.fiserscience.com/statistics.html • – I have a whole page of words I think you might need as a reference place. • Statistics is the science of conducting studies to collect, organize, summarize, analyze, and draw conclusions from data.Descriptive statistics consists of the collection, organization, summarization, and presentation of data. Inferential statistics consists of generalizing from samples to populations, performing estimations and hypothesis tests, determining relationships among variables, and making predictions.Probability: the chance of the event occurring. Use in inferential statistics.
More vocabulary: • A population consists of all subjects (human or otherwise) that are being studied.A sample is a group of subjects selected from a population.Discrete variables assume values that can be counted.Continuous variables can assume an infinite number of values between any two specific values. They are obtained by measuring. They often include fractions and decimals
Qualitative vs. Quantitative • Marital status of nurses in hospital. • Time it takes to run a marathon. • Weights of lobsters in a tank in a restaurant. • Colors of automobiles in a shopping center parking lot. • Ounces of ice cream in ice cream float. • Capacity of the NFL football stadiums. • Ages of people living in a personal care home.
Discrete vs. Continuous • Number of pizzas sold by Pizza Express each day. • Relative humidity levels in operating rooms at local hospitals. • Number of bananas in a bunch at several local supermarkets. • Lifetime (in hours) of 15 Ipod batteries. • Weights of the backpacks of first graders on a school bus. • Number of students each day who make appointments with a math tutor at a local college. • Blood pressures of runners in a marathon.
1. Graphing • The first step in data analysis and data exploration is to create graphical displays of the data that reflect the questions the investigation purports to answer. • Effective graphs convey summary or descriptive statistics as part of the display.
It is not practical to think you can count everything.Most of the time, that would simply be impossible. • So we take samples. • Statistics takes samples and make inferences that represent the true population. Sampling follows predictable patterns. It’s theoretical.
Mean, Median, Mode(Central tendencies) Mean means average, so the first time you think I’m mean….just know I’m average. =)
Standard Deviation The average value away from the average. Math is fun. Good website. http://www.mathsisfun.com/data/standard-deviation.html There are some simple standard deviation problems at The bottom of the page.
Categories The data you collect to will generally fall into three Categories: • Parametric: Normal data. Fits normal curve or distribution. Generally in a decimal form. The bell curve! • Examples: plant height, body temperature, response rate. (The prefix para means side by side. So close in comparison, not like an outlier. If para means normal, does paranormal activity mean normal normal activity? ) • Nonparametric: not normal. Does not fit a normal distribution. May include outliers. Can be ordered. Can be big, medium, small (qualitative) • Frequency or count data: How many fits in this category? Flies you counted with normal wings, etc.
Questions to divide into 2 groups. • Is A different than B? • How are A and B correlated? • To design a good investigation, the type of data needed to answer your question has to be decided during the planning stages. What kind of question is being asked and what kind of data will be required to answer it?
5 types of graphs • 1. Bar Graphs • 2. Scatter plots • 3. Box and whiskers plot • 4. Histograms • 5. Line Graphs
Investigations that need a graph: • 1. Artificial Selection – AP exam 2014 • 4. Diffusion and Osmosis • 5. Photosynthesis • 6. Cellular Respiration • 9. Biotechnology: Restriction Enzyme Analysis of DNA • 12. Fruit Fly Behavior – AP exam 2013 • 13. Enzyme Activity
Bar Graphs • Use two compare two samples of categorical or count data. You will need to compare the calculated means with error bars. Example: qualitative: eye color. Always use Sample Standard error bar. (Sample error of the mean) (SEM)
Scatterplots • Used to explore associations between two variables visually. One variable is measured against another. It is looking for trends or associations. Plotting of individual data points on an x-y plot.
Scatterplots • Sine wave-like Bell-curved
Box-and-whisker plot • Allows comparison of two samples of nonparametric data (data that does not fit a normal distribution) • Medians and quartiles Lowest value, 2: Q1, 3: the Median; 4. Q3, 5. highest value Of set.
Histograms – use this as a preliminary step to see shape. • Frequency diagram. Used to display the distribution of data, providing a representation of the central tendencies (mean, Median, Mode) and the spread of the data. Can then see if parametric or non. • Involves measurement data and data distribution. • Requires setting up “bins” – which are uniform range intervals that cover the entire range of the data. Then the number of measurements that fit in each bin (range of unit) are counted and graphed. If enough measurements are made, the data can show the normal distribution, or bell-shaped distribution, on a histogram. • Quantitative, uses averages, spreads from low to high; continuous data such as time, or measurements; tenths show minor changes. Sample size should be at least 30.
Record High Temperatures Ipad app: Numbers + Create new spreadsheet: blank Enter just as you see on table. Grab all. Create chart. Add details. Mail symbol. Open in other app then Google Drive.
Line Graphs Can use multiple variables. Usually change over time; line suggests trend
Good Graph reminders:TitleEasy to identify lines and barsClearly labeled with units. X-axis independent variable Y-axis dependent variable Uniform intervals More than one condition: different lines:style,color Indicated on a key Don’t start at origin if your data doesn’t. Standard Error of the Means bars (SEM)
Handbook of Biological StatisticsGood Resource • http://udel.edu/~mcdonald/statintro.html • I find that a systematic, step-by-step approach is the best way to analyze biological data. The statistical analysis of a biological experiment may be broken down into the following steps: • Specify the biological question to be answered. • Put the question in the form of a biological null hypothesis and alternate hypothesis. • Put the question in the form of a statistical null hypothesis and alternate hypothesis. • Determine which variables are relevant to the question. • Determine what kind of variable each one is. • Design an experiment that controls or randomizes the confounding variables. • Based on the number of variables, the kind of variables, the expected fit to the parametric assumptions, and the hypothesis to be tested, choose the best statistical test to use. • If possible, do a power analysis to determine a good sample size for the experiment. • Do the experiment. • Examine the data to see if it meets the assumptions of the statistical test you chose (normality, homoscedasticity, etc.). If it doesn't, choose a more appropriate test. • Apply the chosen statistical test, and interpret the result. • Communicate your results effectively, usually with a graph or table.
Chapter 2: Data Analysis • Labs using DATA ANALYSIS: • 1. ARTIFICIAL SELECTION – FRQ 2014 • 2. MATHEMATICAL MODELING: HARDY-WEINBERY • 3. COMPARING DNA SEQUENCES TO UNDERSTAND EVOLUTIONARY RELATIONSHIPS WITH BLAST • 4. CELL DIVISION: MITOSIS AND MEIOSIS
Data analysis • Descriptive statistics: summarize data. Shows variation in the data, standard errors, best-fit functions, and confidence that sufficient data have been collected. Inferential statistics: involves making conclusions, using experimental data to infer parameters in the natural population. Relies on probability. Most measurements are continuous, infinite number over a period of time. Examples: size, time, height, weight, absorbance. Others are: Count data: qualitative, categorical, example: number of hairs, etc. Requires different statistical tools.
Run through of the steps. • Good idea to do this first, before you design your own experiment. • Most investigations will allow to have an initial run-through with all of class doing the same thing.
Bias How can we be certain if the statistic we use is giving an accurate estimate of? Think of what we want to estimate (the parameter) as the target and the way we estimate it (the statistic) as the arrow. Our statistic is called unbiasedif it is close to being on target. Our statistic is called biasedif it is not close to being on target.
Bias We determine bias of a statistic by comparing the center of its sampling distribution to the parameter being estimated. Sample means and proportions are both unbiased estimators.
Sample means Population If the population is N(m,s), then the sample means distribution is N(m,s/√n). For normally distributed populations When a variable in a population is normally distributed, then the sampling distribution of x bar for all possible samples of size n is also normally distributed.
Sample Standard Error • Allows for inference of how sample mean matches up to the true population. • A distribution of the sample means helps define boundaries of confidence in our sample. 1 SE describes 67% confidence range. 2 SE defines 95% certainty Confidence limits contains the true population mean. 95% confident: larger range to contain the population mean. (95% of the data found here) 67% confident: narrower range to contain the population mean. SE – inference in which to draw conclusions SD – just looking at data 95% is trade off for never being 100% sure.
Inference/Confidence Intervals/Empirical Rule/ 67-95-99.7 Rule Confidence Intervals: Use to determine if two populations are different from one another. Think Erika had slide on narrowing due to increase in pop????
Parametric or Nonparametric:maybe if we have time and enough sticky notes, we’ll do this. What’s in your tool bag?
So, we made a histogram of the information. Looked for our shape. Now concluded parametric or nonparametric. • If parametric, we will use our sample size, mean standard deviation, and standard error to analyze. If nonparametric, we will use medians, modes, quartiles, and range . Often use a box and whiskers plot. These are the tools we will use for each type to analyze and describe it.
Then descriptive statistics: • https://www.khanacademy.org/math/probability/statistics-inferential/confidence-intervals/v/confidence-interval-1 The Khan Academy Video below will help you wrap your head around the all of these methods used to analyze. I don’t see us needing to do Calculations but An understanding Is needed.
Parametric or Nonparametric? http://www.washingtonpost.com/blogs/wonkblog/wp/2013/03/06/this-viral-video-is-right-we-need-to-worry-about-wealth-inequality/ Interesting video included in above link about Wealth distribution.
Chapter 3: Hypothesis Testing • Necessary in the following Investigations: • 1. Artificial Selection • 2. Mathematical Modeling: Hardy-Weinberg • 3. Comparing DNA: BLAST • 4. Diffusion and Osmosis • 5. Photosynthesis • 6. Cellular Respiration • 7. Cell Division: Mitosis and Meiosis • 8. Biotechnology: Bacterial Transformation • 9. Biotechnology: RE of DNA • 10. Energy Dynamics • 11. Transpiration • 12. Fruit-Fly Behavior • 13. Enzyme Activity
Hypothesis • A hypothesis is a statement explaining that a causal relationship exists between and underlying factor (variable) and an observable phenomenon. • You might propose a tentative explanation and this would be called your working hypothesis. • ABSOLUTE PROOF IS NOT POSSIBLE, SO WE FOCUS ON TRYING TO REJECT A NULL HYPOTHESIS. • A null hypothesis is a statement that the variable has no causal relationship. • An alternative to the null hypothesis would be that there is a size difference, etc.