Download
1 / 17
170 likes | 281 Vues
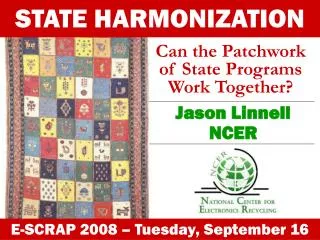
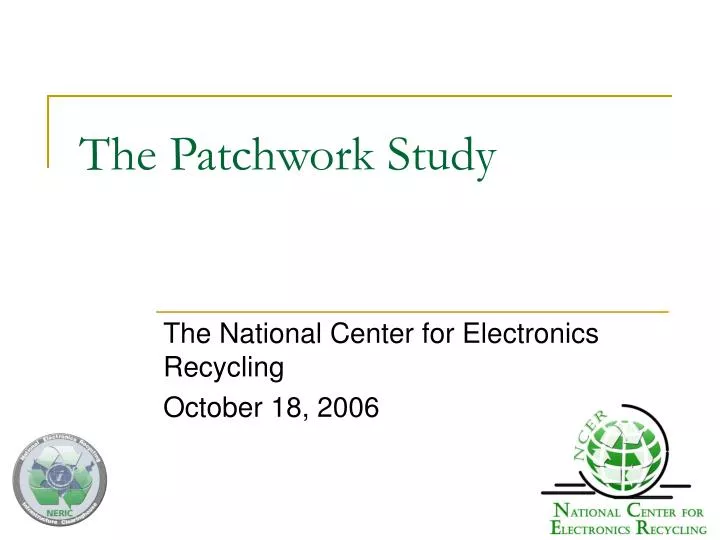
The Patchwork Study. The National Center for Electronics Recycling October 18, 2006. Study Purpose. To analyze the economic and other effects of the state-by-state patchwork on industry, government and consumers

E N D
The Patchwork Study The National Center for Electronics Recycling October 18, 2006
Study Purpose • To analyze the economic and other effects of the state-by-state patchwork on industry, government and consumers • Conducted by the National Center for Electronics Recycling (NCER), a 501(c)3 organization headquartered in Davisville, West Virginia • Produced for the National Electronics Recycling Infrastructure Clearinghouse (NERIC) and published at www.ecyclingresource.org
Patchwork Study Scope • Identify and quantify existing and potential effects of the current patchwork of state-level requirements • Analyze public and private sector experiences with mandatory programs in CA, ME, MD, WA • ….BUT NOT analysis of: • Inherent benefits or drawbacks of any mandatory approach • Effect of jointly implemented/harmonized state systems • Advocacy for or against any legislation
Study Data Sources • The NCER interviewed principal public and private stakeholders involved in the administration and implementation of state electronics recycling programs, including: • Several large industry stakeholders complying with state program requirements • Government officials interviewed during NCER site visits to California and Maine • Discussions with implementation officials in Maryland and Washington State
Study Methodology • We identified state-level costs incurred by public and private sector stakeholders • Administrative and Compliance Costs • Materials Handling and Processing Costs • We then posed this question • Which costs would also be incurred in a comprehensive national program? (see next slide) • We then estimated patchwork costs • State level costs that would *not* be incurred in a national program are considered “dead weight”
National Program Assumptions Used to Determine “Dead Weight” State Costs • E-scrap collection would be done locally with financing from a centralized Collection Incentive Payment (CIP) system or similar national-scale financing mechanism • There would be one coordinated administrative system to oversee financing, coordinate reporting, enforcement and other program requirements • E-scrap would be treated as an interstate commodity and would move across state lines without consideration of the state of origin • There would be one set of national program requirements on financing, information reporting, recordkeeping, etc.
Categories of Cost Drivers • Direct Labor. For purposes of this study direct labor costs are assumed to be all employers’ personnel expenses dedicated to performing tasks attributable to that employer’s primary mission (e.g., recycling electronics, administering a government program, etc.) • General and Administrative (G&A) costs are any management, financial, and other expense for the general management and administration of the company or agency as a whole. G&A costs also include expenses typically provided by outside parties (legal and accounting services, monitoring and reporting services, printing materials, etc.) • Capital Investments are costs supporting the acquisition or development of property or other long-term asset (e.g., information systems, spare plant and equipment, etc.)
Cost Driver #1: Policing and Excluding Out-of-State Wastes • A legislative requirement for collectors in California and Maine • State governments also incur related costs in issuing regulations, reviewing and processing claims (California) • Percentage of this cost considered “dead weight” (costs not incurred in a national program): 100% • Annual recurring dead weight cost: $10 million
Cost Driver #2: Manufacturer and Retailer Compliance • The patchwork has resulted in differing and redundant state compliance requirements on industry, including: • Retailer notification (California) • “Do not sell” retailer requirements (Maine, Maryland, Washington) • Identification of in-scope products (Maine, Maryland, Washington, California). Note that the scope of covered products is different in all four states. • Manufacturer registration requirements (all four states) • Reporting requirements (all four states), including ARF reporting in California • Percentage of these cost considered “dead weight”: 50% • Annual recurring dead weight cost: $3.6 million
Cost Driver #3: Redundant System Administrations • Major administrative duties required in various state programs: • Billing systems (e.g., ARF fees in California, consolidator fees in Maine) • Producer registration systems (all) • Returned brand counts (Maine, probably Washington) • Orphan product determinations and calculations (Maine, probably Washington) • Enforcement, including identifying responsible producers and/or retailers (all) • Public education (all) • System governance/oversight (e.g., default Authority in Washington, CIWMB in California, Maryland DEP, Maine DEP) • Appellate procedures for challenges to administrative decisions • Fund management, whether for all recycling funds (California, Maryland), through consolidators (Maine), or a state-created authority (WA). Some states also use these funds to manage penalties against non-compliant companies. • Percentage of this cost considered “dead weight”: 20% • Annual recurring dead weight cost: $2.5 million
Cost Driver #4: Redundant State Program Development Engagements • State-level study committees • Thousands of meetings with state officials/others to discuss, plan and debate the trajectory and details of state electronics recycling programs • Percentage of this cost considered “dead weight”: 100% • Annual recurring dead weight cost: $8.8 million
Cost Driver X: Future State Programs Trajectory Uncertain • Continuous evolution and increasing complexity of state program requirements creates uncertainty for manufacturers, retailers, recyclers and local governments • Inhibits effective planning across all stakeholders • Such policy uncertainty would be eliminated in a single national system • No conclusive data found to quantify this cost driver – therefore not included in study results
Cost Driver Y: Potentially Higher Recycling Costs for State Programs Two types of economy of scale issues: • Lack of economies of scale available in a national system, primarily the lack of national-scale volumes of collected electronics that would support higher volume/lower cost automated systems, and • Market fragmentation resulting from state restrictions placed on the free flow of collected electronics outside their state boundaries (California, Washington) • No conclusive data found to quantify this cost driver – therefore not included in study results
Patchwork Inequities (not quantified) • These inequities could result in one set of stakeholders incurring a disproportionate share of costs and others getting a free ride, but would not increase system costs overall • State Program Financing Overlap, Over-chargers and Free Riders • ARFs May Only be Required from Retailers with a State “Nexus” • Other State-Level Enforcement Challenges
Conclusions • The current 4-state patchwork wastes about $25 million annually that could otherwise be spent on collecting & recycling electronics • Costs are borne across stakeholders • Current trajectory not good: more patchwork dead weight coming to a state near you • Each state going its own way • About 1 new state mandate per year since 2003 • If trajectory continues, more than $100 million in dead weight per year by 2016
Thank You • For more information go to the National Electronics Recycling Infrastructure Clearinghouse at www.ecyclingresource.org Walter Alcorn for the NCER walter@alcornconsulting.com