Download
1 / 13
130 likes | 217 Vues
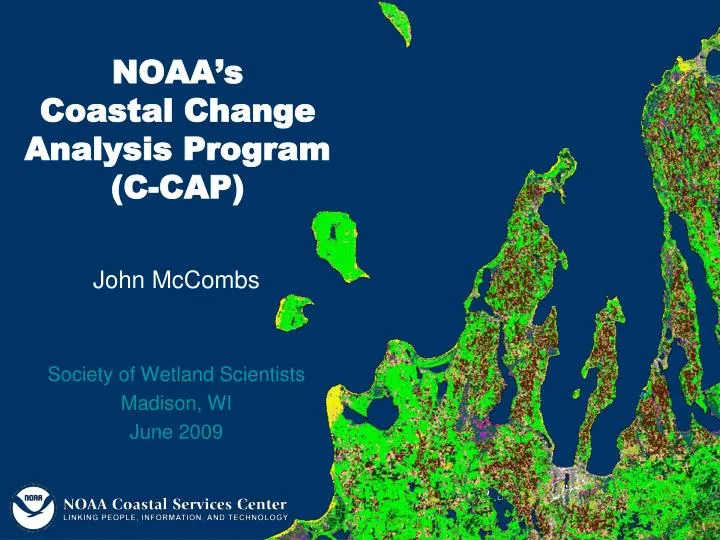
NOAA’s Coastal Change Analysis Program (C-CAP). John McCombs Society of Wetland Scientists Madison, WI June 2009. The Coastal Change Analysis Program. National coastal land cover and change mapping program

E N D
NOAA’sCoastal Change Analysis Program (C-CAP) John McCombs Society of Wetland Scientists Madison, WI June 2009
The Coastal Change Analysis Program • National coastal land cover and change mapping program • Inventory of intertidal areas, wetlands, and adjacent upland, produced/updated every 5 years • Consistent, accurate products through standard data and methods • Coastal Expression of the National Land Cover Database (NLCD) “Designed to help improve understanding of linkages between land change and the environment” 2006 Update Complete 2006 Date In-progress
Results of 2001 Mapping Accuracy of C-CAP • Over 2.3 Billion pixels served • Approximately 817,500 mi2 mapped per date • Over 20,000 AA points collected through 11 efforts • Over 2100 validation points through 9 efforts 7% Example of AA and validation locations In Gulf Coast Mapping Zone 46 • Overall Accuracy was assessed at 86.3 % • Range of individual assessment were from 76-91% • Validation confirmed a range of 77-90%
Results of 2001 Mapping 1996 to 2001 Change Summary • Area equal to the size of the state of Maine changed, in the Coastal CONUS, between 1996 and 2001 • Largest area(s) of change are a result of siviculture activities • Many of these can be offsetting changes with little net impact • Increase in developed area equal to 7.5 times the area of New York City (2,275 sq miles) • 10% of coastal counties account for almost half of this total • Occurring at a faster rate in the Southeast (53%) • Approx. half of this increased development area is low intensity 7%
Wisconsin 1996 - 2006 • Increasing Development • Increase from 1636 mi2 (1996) to 1741 mi2 (2006) • Larger gains in lower intensity development typically found in urban sprawl • Wetland changes • Decrease 20.8 mi2 woody wetlands, increase 9.3mi2 emergent wetlands • 4.8 mi2 wetlands changed to Developed
Silviculture • Small net loss forested area (15663 mi2 to 15640 mi2) • Offsetting losses (194 mi2) and gains (171 mi2) • Forest -> Bare -> Grass -> Scrub -> Forest
Digital Coast Land Cover Atlas • Way for technical and non-technical users to: • Visualize land cover distribution, condition • Query and analyze specific changes of interest • Generate reports, maps, and summary info
High Resolution Land Cover • Customer demand / need . . . • and • Increasingly available, high-res imagery and supporting data • provide • New opportunities to • Introduce new data streams • Introduce new approaches • Increase focus on coastal issues “Our goal is to provide consistent, accurate, nationally relevant data at a spatial scale more appropriate for support of increasingly detailed, site-specific, management decisions”.
Multi-Resolution Land Cover • Value of C-CAP is in providing a complete, consistent coverage of coastal land cover, • and commitment to regular updates • Moderate resolution land cover will not soon be replaced by higher resolution mapping • High res products should strive to complement regional products • Consistent, relevant information that supports flexible applications • High Res land cover could be a consistent “jumping point” for more detailed classifications
Future • Status and Trend reporting • Interagency Coastal Wetlands Team • EPA led with contributions from NOAA, USFWS, USDA, NRCS, USACE and FHWA • NWI and Status and Trends • Value added products • Tools • N-SPECT, HPP, ISAT, SLAMM • Wrap up 2006 updates this year
Questions? John McCombs 843-740-1164 John.McCombs@noaa.gov www.csc.noaa.gov/landcover