Download
1 / 55
560 likes | 688 Vues
Quantitative analysis of multi-temporal and multi-modal in-vivo images in small animal models. Ir. Janaki Raman Rangarajan Promoter: Prof. Dr. Ir. Frederik Maes. Introduction Quantitative Image analysis Small animal models Image analysis pipeline:

E N D
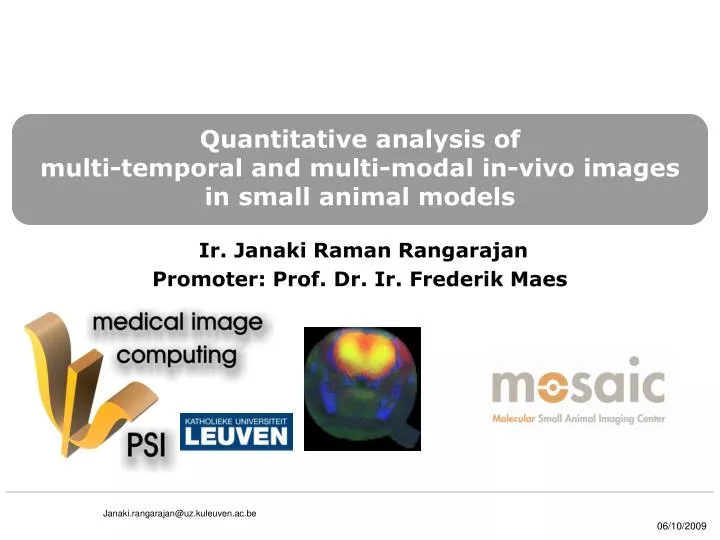
Quantitative analysis of multi-temporal and multi-modal in-vivo images in small animal models Ir. Janaki Raman Rangarajan Promoter: Prof. Dr. Ir. Frederik Maes
Introduction Quantitative Image analysis Small animal models Image analysis pipeline: Multi temporal, multi modal registration & segmentation methods Quantification tools Results & Discussion Applications Conclusion Future work Image Acquisition (IAq) Image Pre-processing (IPp) Image Registration (IRg) Image Quantification (IQn) Overview Janaki Raman R
Quantitative image analysis • Image quantification - From ‘seeing’ to ‘measuring’ Requires object delineation or “image segmentation” 5w PI 8w PI 14w PI 30w PI Janaki Raman R
Fusion of complimentary information Multi-temporal: Follow up over time Requires spatial alignment or “image registration” Multi-modal: Anatomical & functional info 5w PI 30w PI Janaki Raman R
In vivo Small Animal Image Analysis • Image artifacts • RF in homogeneity • Animal models • Transgenic/Wild-type • Rats - Wistor, SD.. • Mice - C57BL6J, ob/ob, .. • Images • Group: 10 • Sequence : 2 • Time point: 5 + 1(exvivo) • Images to analyze: 60 x 2 Janaki Raman R
MoSAIC – QUANTIVIAM collaborations Janaki Raman R
Image analysis pipeline: ESAT/PSI • Automated (semi) methods • Segmentation, registration, quantification of small animal images • Multi-temporal & multi-modal • µMR-µMR, µMR-µMRTemplate, µMR-µPET, ….. • Applications • MRI reporters, Morphological phenotyping, Planning acquisition Janaki Raman R
PhD Goal • Develop (semi) automatedmethods • Segmentation • Registration • Quantification in small animals • Multi-temporal & multi-modal • µMR-µMR, µMR-µPET, µMR-µCT….. • Registration • Rigid, affine, non-rigid registration (mesh..) • Segmentation • Atlas/Template based segmentation • Application driven • MR reporters, Fat quantification, morphological phenotyping, …… • Year 1: • Build pipeline, evaluate existing methods • Year 2: • Multi-temporal to Multi-modality • Rigid to Non-rigid registration • Year 3: • Multi-modality extension, Applications • Year 4: • Validation, applications, report Janaki Raman R
Image Acquisition (IAq) Image Pre-processing (IPp) Motion correction: bt. repetitions Bias field correction Segmentation: Brain mask Image Registration (IRg) Atlas based segmentation Normalization: Follow up to base line Co-registration: template / atlas Image Quantification (IQn) Image Analysis Pipeline Micro-MRI acquisition: Bruker conversion: bruker-dicom-analyze Segmentation: VOI‘s Intensity normalization Quantification: MR constrast TOPIM, Jan 2009 Janaki Raman R
Image Acquisition (IAq) Image Analysis Pipeline - Acquisition Micro-MRI acquisition:Bruker 9.4T conversion: bruker-dicom-analyze @ µNMR lab MoSAIC, KUL • Resolution ~156 µm or 32 µm (ex-vivo) • FOV [3.0x5.0x1.5] cm Janaki Raman R
Image Acquisition (IAq) Image Pre-processing (IPp) Motion correction: bt. repetitions Bias field correction Segmentation: Brain mask Image Registration (IRg) Atlas based segmentation Normalization: Follow up to base line Co-registration: template / atlas Image Quantification (IQn) Image Analysis Pipeline Micro-MRI acquisition: Bruker conversion: bruker-dicom-analyze Segmentation: VOI‘s Intensity normalization Quantification: MR constrast TOPIM, Jan 2009 Janaki Raman R
Image Pre-processing (IPp) Motion correction: bt. repetitions Bias field correction Segmentation: Brain mask Image Analysis Pipeline Raw data Motion corrected, averaged, N=12 • RF field in-homogeneity • Source: RF coil /static field in-homogeneity, patient anatomy or position • Effect : Intensity variations of same tissue type • Derails - segmentation, registration or quantification Janaki Raman R
Motion correction bt. repetitions Bias field correction Segmentation: Brain mask Image Pre-processing MR Inhomogeneity correction Original Corrected(masked) Corrected Multiplicative model, 3D 4th order polynomial, entropy minimization, mean preserving (Likar et al.) Intensity distribution Original Corrected • => Background separation • Speed up from polynomial order 1 to 4 Bias field Janaki Raman R
Multi-temporal study – ROI delineation Baseline ROI manually delineated in baseline/atlas scan and automatically propagated to co-registered follow-up scans allows voxel-wise analysis MIRIT - affine Maximization of Mutual Information (Collignon A, Maes F, et. al) Follow-up Janaki Raman R
Atlas based segmentation Alignment: Follow up to base line Normalization: template / atlas Image registration – Multi-temporal Image Registration • Image difference: • different animal position • anatomical difference Follow-up Before registration After registration 5w PI Baseline 8w PI 3w PI 30w PI • Maximization of Mutual Information (Collignon A, Maes F, et. al) • Mutual information of corresponding voxel pairs is maximal if the images are geometrically aligned. • 12 parameter(translation/rotation/shear/scaling) affine transformation TOPIM, Jan 2009 Janaki Raman R
Atlas based segmentation Alignment: Follow up to base line Normalization: template / atlas Spatial alignment – multi-temporal Image Registration 2 months 5 months Rat brain - Sprague Dawley MI based registration (affine): µMRI-µMRI (after bias correction) Janaki Raman R
Image Acquisition (IAq) Image Pre-processing (IPp) Image Registration (IRg) Image Quantification (IQn) Image Analysis Pipeline Micro-MRI acquisition: Bruker conversion: bruker-analyze Segmentation: Brain mask Motion correction: bt. repetitions Bias field correction Coregistration/Normalization Multi-modality registration: µPET- µMR MR as prior: PET reco. (J Nuyts, K.U.L) Intensity normalization (MR) Quantification µPET- µMR Segmentation: VOI‘s Janaki Raman R
Multi-modal registration 2 months 2 months Without bias field correction & mask With bias field correction & mask ML reconstruction + MRI (prior) -> Bowscher Reconstruction J. Nuyts, A. Atre, K.Vunckx Nuclear medicine, KUL 10 months 10 months Janaki Raman R
Atlas based segmentation Alignment: Follow up to base line Normalization: template / atlas Spatial normalization to template Image Registration Study Atlas Atlas Atlas MBIRN, MDA 2006, mouse brain template P. Schweinhardt 2003, rat brain template MI based registration (affine): µMRI-µMRT (after bias correction) Janaki Raman R
Atlas based segmentation Study MBIRN data base – C57BL6 MDA Atlas Test injection Control injection Reference region TOPIM, Jan 2009 Janaki Raman R
Inter-scan intensity normalization Test injection Control injection Reference region Janaki Raman R
Image Acquisition (IAq) Image Pre-processing (IPp) Image Registration (IRg) Image Quantification (IQn) Image Analysis Pipeline Micro-MRI acquisition: Bruker conversion: bruker-analyze Segmentation: Brain mask Motion correction: bt. repetitions Bias field correction Coregistration/Normalization Multi-modality registration: µPET- µMR MR as prior: PET reco. (J Nuyts, K.U.L) Intensity normalization (MR) Quantification µPET- µMR Segmentation: VOI‘s Janaki Raman R
Case Study1: Imaging Neurogenesis • Viral vector based genetic labeling • Luciferase (BLI) vs Ferritin (MRI) Division of Molecular Medicine 5wPI G Vande Velde, A. Ibrahimi, V. Baekelandt, Z Debyser Janaki Raman R
Viral vector based MRI reporter genes eGFP Lentiviral Vector(LV) PBS Adeno associated Vector(AAV) NOD-SCID Janaki Raman R ISMRM, Hawaai Apr 2009; WMIC Sep 2009.
Image analysis of MRI reporters 5w PI 8w PI 14w PI 30w PI • Conventional quantification • Qualitative visual examination • Manual delineation of ROI’s • Parametric maps • Disadvantages • Manual analysis is tedious and error-prone (user, artifacts) • Low resolution of parametric maps & hypo-intense contrast of MRI reporters Janaki Raman R
Bias field correction Segmentation: Brain mask MRI reporter - Pre-processing step Source Initial mask Bias field Bias corrected MRI Final mask Brain mask C57bL6/J black mice exp 15: AAV06c Janaki Raman R
MRI reporter - Registration step MI based Image alignment & normalization ofC57bL6/J black mice with MBIRN atlas exp 15: AAV06a vs. AAV 06c Janaki Raman R
MRI reporter : Quantification step • Visualization of segmented hypo-intense MR contrast (Ferritin) in axial & coronal planes Visualization of segmented hypo-intense MR contrast (Ferritin) in Paxinos reference frame Janaki Raman R
Results : LV immune response Janaki Raman R World Molecular Imaging Conference, Sep 2009
Results : LV immune response Janaki Raman R World Molecular Imaging Conference, Sep 2009
Results: LV vs AAV background Janaki Raman R World Molecular Imaging Conference, Sep 2009
Results: AAV immune response Janaki Raman R World Molecular Imaging Conference, Sep 2009
Conclusions of MRI reporter study • LV vector contributes significantly to background contrast • Backgound contrast challenges SNR of potential vector based MR reporters(e.g. Ferritin) • AAV vector results in very low background contrast in comparison to LV • AAV is promising for other potential MR reporter genes! • Publications- Ferritin case study • G. Vande Velde, J.R. Rangarajan, T. Dresselaers et. al Evaluation of lentiviral and adeno-associated viral vector systems for ferritin expression as MRI reporter gene in mouse brain. Journal of NeuroImaging (in preparation) • G. Vande Velde, J.R. Rangarajan, T. Dresselaers, J. Toelen, Z. Debyser, V. Baekelandt, U. Himmelreich, Quantification of 3D T2*-weighted MR images allows evaluation of different viral vectors for stable MR reporter gene expression in the rodent brain, ISMRM - ESMRMB joint annual eeting, May 1-7, 2010, Stockholm, Sweden (accepted) • G. Vande Velde, J.R. Rangarajan, T. Dresselaers, A. Ibrahimi, Z. Debyser, V. Baekelandt, U. Himmelreich, Comparison of lentiviral and adeno-associated viral vectors for stable MRI reporter gene expression in the rodent brain, 2009 world molecular imaging congress Sep. 2009, Montréal, Canada • G. Vande Velde, J.R. Rangarajan, T. Dresselaers, O. Krylyshkina, A. Ibrahimi, Z. Debyser, V. Baekelandt, U. Himmelreich, Evaluation of LV and AAV vector systems for stable delivery of MRI reporter genes to the rodent brain, ISMRM April 2009, Honolulu, Hawaii • J.R. Rangarajan, G. Vande Velde, U. Himmelreich, T. Dresselaers, C. Casteels, A. Atre, D. Loeckx, J. Nuyts, F. Maes, An image analysis pipeline for quantitative analysis of multi-temporal and multi-modal in vivo small animal images, TOPIM 2009 - dual and innovative imaging modalities, January 26-30, 2009, Les Houches, France • “Quantitative multi-temporal image analysis of MRI reporters in rodent brain” (in preparation) Janaki Raman R
Longitudinal MPIO quantification NeuroImage 2009 Janaki Raman R
Pilot study – MPIO vs. reporter gene • MPIO in RMS using the pipeline, on best known protocol • MPIO quantification both within in vivo and ex vivo • Compare MPIO vs. Vector based MRI reporter • In progress : • Pre-processing (done); Registration & Quantification (ongoing); Janaki Raman R
MPIO @Rostral Migratory System Registration to MBIRN MDA atlas, overlayed with labels Janaki Raman R
Atlas based segmentation of RMS Label Outline Label Mask Janaki Raman R
Case study 2: Multimodal imaging in HR Wild type (control) Transgenic (HD) • Morphological phentoyping • Transgenic (HD) • Wild type (control) • Multi-temporal quantification • 2M, 5M, 10M, 18M… • Morphological changes • Within & between phenotypes • Multi-modal study • µMR-µPET (rigid) • µMR-µMR template (affine, non-rigid) von Horsten, S. et al. Hum. Mol. Genet. 2003 2 M 5 M 10 M 18 M WT HD Tg µMRI : RARE 3D, T2 µPET : FDG, CB1 C Casteels, J Nuyts, K Van Laere, Nuclear Medicine, KU Leuven Janaki Raman R
Image analysis Huntington rats 2 months Casteels C 2006 2 months Casteels C 10 months 10 months Janaki Raman R
A) RIGID(R1) B) AFFINE (R2) NON-RIGID (R3) C) R1 (R2, R3) Multi-temporal, multi-modal registration MR PET MMI based Registration MR atlas in Paxinos space Janaki Raman R
Pre-processing step No Bias correction 2 months 2 months 5 months 5 months 10 months 10 months 18 months 18 months Bias corrected & brain mask Janaki Raman R
Multi-temporal spatial alignment in HR 2 months 10 months Janaki Raman R
Multi-modal registration: mPET-mMR µMRI µPET (no BFC) µPET (with BFC) MI based registration (rigid): µPET-µMR Influence of bias field correction and brain mask selection Janaki Raman R
Morphological phenotyping 18M Wild Type – control group 5M Transgenic – Huntington rats I > mean + 2*stddev (- not robust ) - Good BFC & registration can help better segmentation 18M Janaki Raman R
Results • Initial results • Successful mPET- mMRI registration • Benefits mPET reconstruction • mMRI - mMRI temporal & template registration • A good brain mask & bias field correction(BFC) is important • In progress • Improve BFC in cooperation with VisionLab • Building individual template/ time point– affine/NRR • Robust segmentation of both striatum & ventricles Janaki Raman R
Future work: Image analysis • Summary • The image analysis pipeline with image registration framework facilitates quantification of multi-temporal & multi-modal study in small animal models • Future work • Planning of stereotactic surgery • Plan optimal trajectory. • Variability in needle tracts • Possibility of missing anatomical ROI • Trajectory could hit vasculature=> immune response • MR acquisition • Localize better acquisition plane during image acquisition of time series images. Janaki Raman R
Functional neurosurgery Anorexia (e.g. Septal nucleus) Neuromodulation Injections Electrical stimulation Lesions Bleeding Burr holes (Visible) Other brain regions(?) Influences.. Systematic unwanted side effects Neuro Anatomical Surgical Planning Kris van Kuyck, Bart Nuttin. Lab. of experimental & functional neurosurgery, KUL Source: U. Himmelreich, KUL Janaki Raman R
Planning optimal trajectory using MRA • Register/Overlay • Anatomical MRI with MRA • Anatomical MRI with Paxinos Atlas • Anatomical variability • Probabilistic atlas of vasculature in Paxinos Kris van Kuyck, Bart Nuttin. Lab. of experimental & functional neurosurgery, KUL Janaki Raman R
Optimal trajectory in Paxinos space Lesions (e.g. septal nucleus) ROI based image plane positioning Tractography along Neuromodulation regions 1. Trajectory: Lesion/Stimulation Electrode 2. ROI: Lesion 3. Fiber tract running along ROI Neuronal connectivity @Neuromodulation Kris van Kuyck, Bart Nuttin. Lab. of experimental & functional neurosurgery, KUL • Investigate • Registration (ESAT) • Atlas construction (ESAT) • Quantification of brain connnectivity(VLAB/ESAT) Janaki Raman R
Lateral 1.6 mm Lateral 1.6 mm 2 mm 2 3 mm 2 1 1 Localization: SOI in paxinos2MR SOI – Site of injection Janaki Raman R