Download
1 / 30
300 likes | 441 Vues
The Ability of Radio Heliospheric Remote Sensing Observations to Provide Global Solar Wind Parameters. Bernard V. Jackson, P. Paul Hick, Andrew Buffington, Hsiu-Shan Yu, Center for Astrophysics and Space Sciences, University of California at San Diego, LaJolla, CA, USA Mario M. Bisi

E N D
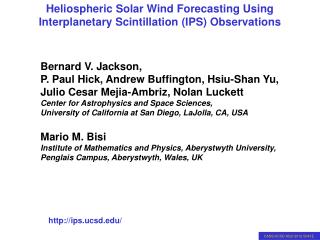
The Ability of Radio Heliospheric Remote Sensing Observations to Provide Global Solar Wind Parameters Bernard V. Jackson, P. Paul Hick, Andrew Buffington, Hsiu-Shan Yu, Center for Astrophysics and Space Sciences, University of California at San Diego, LaJolla, CA, USA Mario M. Bisi Institute of Mathematics and Physics, Aberystwyth University, Penglais Campus, Aberystwyth, Wales, UK Richard A. Fallows ASTRON, the Netherlands Institute for Radio Astronomy, Postbus 2, 7990 AA, Dwingeloo, Netherlands http://ips.ucsd.edu/ http://smei.ucsd.edu/ Masayoshi
Introduction: The data: Interplanetary Scintillation (IPS) STELab, Ooty, EISCAT 3D density and velocity reconstructions from IPS Recent programming enhancements and their use in forecasting The Future – MEXART, Possible Faraday rotation observations
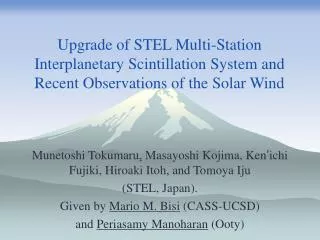
IPS Heliospheric Analyses (STELab) DATA IPS line-of-sight response STELab IPS array near Mt. Fuji STELab IPS array systems
Current STELab Toyokawa IPS System New STELab IPS array in Toyokawa (3,432 m2 array now operates well – year-round operation began in 2011)
Other Current Operating IPS Radio Systems The Ootacamund (Ooty), India off-axis parabolic cylinder 530 m long and 30 m wide (15,900 m2) operating at a nominal frequency of 326.5 MHz. The Pushchino Radio Observatory 70,000 m2 110 MHz array, Russia (summer 2006) Now named the “Big Scanning Array of the Lebedev Physical Institute” (BSA LPI).
Other Current Operating IPS Radio Systems Above: The European Incoherent SCATter radar (EISCAT) and EISCAT Svalbard Radar (ESR) radio telescopes from left-to-right: Tromsø, Norway (M.M. Bisi, October 2003); Kiruna, Sweden (M.M. Bisi, May 2003); Sodankylä, Finland (http://www.eiscat.com/sodan.html); and the ESR 42m in the foreground and steerable 32m in the background (M.M. Bisi, May 2005). Left: The Multi-Element Radio-Linked Interferometer Network (MERLIN) MkIa (Lovell) radio telescope at Jodrell Bank (near Manchester, England); and Right: The MERLIN MkII radio telescope also at Jodrell Bank (M.M. Bisi, May 2004). The Ootacamund (Ooty), India off-axis parabolic cylinder 530 m long and 30 m wide (15,900 m2) operating at a nominal frequency of 326.5 MHz. The Pushchino Radio Observatory 70,000 m2 110 MHz array, Russia (summer 2006) Now named the “Big Scanning Array of the Lebedev Physical Institute” (BSA LPI).
World-Wide IPS observation network Pushchino103MHz 70,000㎡ STEL Multi-Station 327MHz 2000 ㎡×3, 3500 ㎡ MEXART 140MHz、10,000㎡ IPS UK/EISCAT LOFAR) Russia Korea Japan India Mexico MWA 80-300MHz Ooty 327MHz、16,000㎡ US-Australia
IPS line-of-sight response Jackson, B.V., et al., 2008, Adv. in Geosciences, 21, 339-360. Heliospheric C.A.T. analyses: example line-of-sight distribution for each sky location to form the source surface of the 3D reconstruction. STELab IPS Sample outward motion over time
Jackson, B.V., et al., 2008, Adv. in Geosciences, 21, 339 Relative Weighting Outward Radial Motion
IPS line-of-sight response Jackson, B.V., et al., 2008, Adv. in Geosciences, 21, 339-360. Heliospheric C.A.T. analyses: example line-of-sight distribution for each sky location to form the source surface of the 3D reconstruction. STELab IPS 14 July 2000 13 July 2000
IPS C.A.T. Analysis Jackson, B.V., et al., 2002, Solar Wind 10, 31 Bastille Day Event 14 July 2000
IPS C.A.T. Analysis Jackson, B.V., et al., 2002, Solar Wind 10, 31 Bastille Day Event 14 July 2000
IPS C.A.T. Analysis Jackson, B.V., et al., 2002, Solar Wind 10, 31 Bastille Day Event 14 July 2000
IPS C.A.T. Analysis Jackson, B.V., et al., 2002, Solar Wind 10, 31 Bastille Day Event 14 July 2000 IPS Density Meridional Cut IPS Density LOS X-ing Meridional Cut
Zhao, X. P. and Hoeksema, J. T., 1995, J. Geophys. Res., 100 (A1), 19. http://ips.ucsd.edu/ Magnetic Field Extrapolation • Inner region: the CSSS model calculates the magnetic field usingphotospheric measurements and a horizontal current model. 2. Middle region: the CSSS model opens the field lines. In the outer region. 3. Outer region: the UCSD tomography convects the magnetic field along velocity flow lines. Dunn et al., 2005, Solar Physics 227: 339–353. Jackson, B.V., et al., 2012, Adv. in Geosciences, 30, 93-115.
IPS C.A.T. Analysis Dunn, T.J., et al., 2005, Solar Phys., 227, 339 Potential field modeling added IPS Density Remote View
Jackson, B.V., et al., 2010,Solar Phys., 265, 245-256. IPS line-of-sight response Jackson, B.V., et al., 2010, Adv. in Geosciences, 21, 339-360. Jackson, B.V., et al., 2012,Solar Phys. published on-line. Heliospheric C.A.T. Analyses: example line-of-sight distribution for each sky location to form the source surface of the 3D reconstruction. Innovation STELab IPS * 13 July 2000 Inclusion of in-situ measurements into the 3D-reconstructions
Heliospheric 3D-reconstructions Jackson, B.V., et al., 2010,Solar Phys., 265, 245-256. Innovation Innovation Inclusion of in-situ measurements into the 3D-reconstructions Jackson, B.V., et al., 2008, Adv. in Geosciences, (in press).
Heliospheric 3D-reconstructions Jackson, B.V., et al., 2010,Solar Phys., 265, 245-256. Jackson, B.V., et al., 2011, Adv. in Geosciences, 30, 93-115. Forecast Jackson, B.V., et al., 2012,Solar Phys. published on-line. Density Forecast Forecast Inclusion of in-situ measurements into the 3D-reconstructions Forecasts work better if the values match up to the present. Velocity Forecast
Heliospheric 3D-reconstructions Jackson, B.V., et al., 2010,Solar Phys., 265, 245-256. Jackson, B.V., et al., 2011, Adv. in Geosciences, 30, 93-115. Forecast Jackson, B.V., et al., 2012,Solar Phys. published on-line. Density Density Forecast Inclusion of in-situ measurements into the 3D-reconstructions Forecasts work better if the values match up to the present. Velocity Velocity Forecast
Jackson, B.V., et al., 2011, Adv. in Geosciences, 30, 93-115. http://ips.ucsd.edu/ UCSD Web pages UCSD IPS forecasts Web Analysis Runs Automatically Using Linux on a P.C.
http://ips.ucsd.edu/ Skymap view UCSD IPS forecast Web analysis runs automatically using Linux on a P.C.
Today’s Analysis http://ips.ucsd.edu/ Density overview Web Analysis Runs Automatically Using Linux on a P.C.
http://ips.ucsd.edu/ Jackson, B.V., et al., 2011, Adv. in Geosciences, 30, 93-115. UCSD Web pages UCSD IPS forecasts Aftcast Density CCMC real-time Aftcast Velocity 2012 August 14 23 UT Web Analysis Runs Automatically Using Linux on a P.C.
Recent Forecast http://ips.ucsd.edu/ CME arrival on 2012/11/30 4-6 UT increase by ~8 Np/cc Web Analysis Runs Automatically Using Linux on a P.C.
Recent Forecast http://ips.ucsd.edu/ CME arrival on 2012/11/30 4-6 UT increase by ~8 Np/cc Web Analysis Runs Automatically Using Linux on a P.C.
Other and Potential Future IPS systems MEXART (Mexico) KSWC (South Korea) Dedicated IPS 700 m2 327 MHz IPS radio 32 tile array, Jeju Island Dedicated IPS IPS 9,600 m2 140 MHz IPS radio array near Michoacan, Mexico MWA (Western Australia) LOFAR (Western Europe) (32 tiles are now operating. The full array 128 tiles can obtain some IPS data.) (Some parts of the system are now operating - Richard Fallows, Mario Bisi are involved. IPS/FR tests are ongoing.)
Oberoi and Lonsdale, 2012, Radio Science, 47, RS0K08, doi:10.1029/2012RS004992. Faraday rotation signals at low frequency ‗‗Φ = λ2 ∫ neB•ds From Oberoi and Lonsdale
Future Jackson, B.V., et al., 2008,URAS Workshop ‗‗Φ = λ2 ∫ neB•ds Jensen, E.A., et al., 2010,Solar Phys., 265, 31 Faraday rotation tomography Background Field, 3D UCSD Density Background Field, 3D UCSD Density, Mulligan “Can”
Summary: The Future is here: • Forecasts with the IPS data (this has worked with STELab data for about 12 years). • Forecasts in real-time work better now with the inclusion of in-situ data (has been available since spring, 2011) These new innovations and the inclusion of other world IPS data sets make the technique a competitive way to measure velocities and densities. • FR inversion to obtain vector fields may work, but needs to be incorporated with a robust method of determining density to back out accurate vector magnetic fields remotely.