Download
1 / 35
350 likes | 511 Vues
Happy Creek Data for the Benthic Stressor Analysis. Technical Advisory Committee Meeting Gene Yagow March 11, 2014. Happy Creek Benthic Impairment. Cause Group Code: B41R-03-BEN

E N D
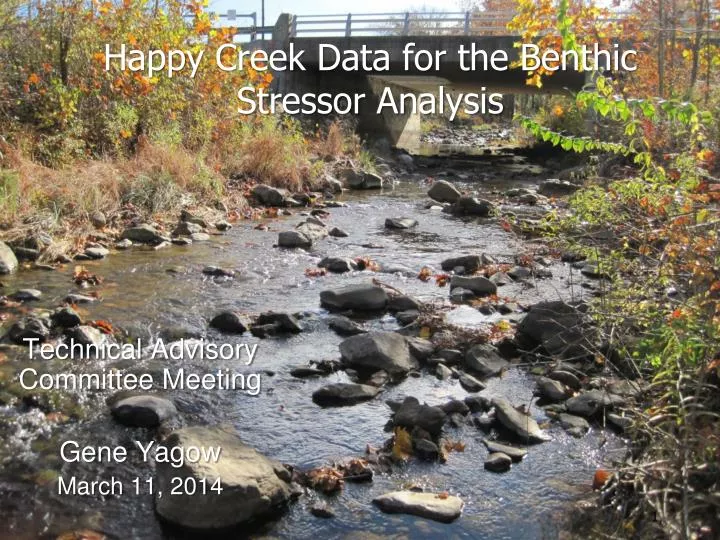
Happy Creek Data for the Benthic Stressor Analysis Technical Advisory Committee Meeting Gene Yagow March 11, 2014
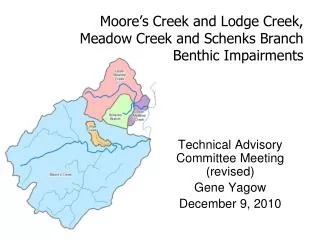
Happy Creek Benthic Impairment Cause Group Code: B41R-03-BEN Location: Happy Creek from the headwaters downstream to its confluence with the South Fork Shenandoah River. (Start Mile: 8.42 End Mile: 0.00 Total Impaired Size: 8.42 Miles) Causes: This segment is impaired due to violations of the General Standard for Benthics at station: 1BHPY001.29 (Impaired for VSCI) and 1BHPY002.67 (Impaired for VSCI). Initial Listing Date: 2008.
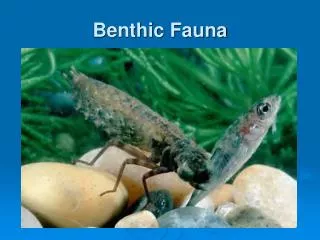
Basis for Impairment Healthy Impaired VSCI = Virginia Stream Condition Index
Stressor Analysis • Benthic impairment does not specify pollutant(s) • Review existing data • Weight-of-evidence approach • Identify potential sources
Landuse Summary Proposed Assumptions for Discussion Pasture/Hay: 40% pasture; 60% hay Pasture: degraded = 40%; non-managed = 30%; improved = 30% Disturbed area = 1% of (Developed) = 16.2 acres
Known Permitted Sources • VPDES Permits - none • Industrial Stormwater General Permits – 1 • VAR050852 Zuckerman Metals, Inc. • General Permits - none
Pollution Response (PReP) Reports 01/20/01: Gasoline spill enters storm sewer; 500 gal 11/16/06: Sewage overflow due to heavy rain; unknown volume (UNK) 08/15/08: Improper pond cleanout, sediment; UNK 09/22/08: Manhole overflowing; UNK 07/19/09: Sewage overflow; 15,000 gal 01/25/10: Sewage overflow at STP; 60,000 gal
Preliminary Eliminated Stressors Ammonia pH Temperature Dissolved Oxygen Metals Ionic strength (conductivity)
Ammonia Data Out of 12 samples at 1BHPY001.29 between Aug-01 and May-03, only 1 sample was greater than MDL (0.20 mg/L on 06/24/02) FOSR Data
pH Data DEQ Benthic Field Data DEQ Ambient Field Data FOSR Ambient Field Data Maximum WQ Criterion Minimum WQ Criterion
Temperature Data DEQ Benthic Field Data DEQ Ambient Field Data FOSR Ambient Field Data Maximum WQ Criterion = 31ºC
Dissolved Oxygen Data DEQ Benthic Field Data DEQ Ambient Field Data FOSR Ambient Data Minimum WQ Criterion
Dissolved and Total Metals Station: 1BHPY002.67 Sample Date: 06/02/08
Sediment-Bound Metals Station: 1BHPY002.67 Sample Date: 06/02/08
Preliminary Possible Stressors • Nutrients • Organic Matter • Hydrological Modifications • Sediment
Nitrogen Data DEQ Ambient Data Sub-optimal Sub-optimal • FOSR Ambient Data Optimal Optimal Sub-optimal Optimal
Phosphorus Data DEQ Ambient Data • FOSR Ambient Data Sub-optimal Sub-optimal Optimal Optimal Sub-optimal Sub-optimal Optimal Optimal
Evidence for Nutrients Nutrient-loving Chironimidae organisms were dominant in 4 out of 9 samples at 1BHPY001.29 and in 2 out of 8 samples at 1BHPY002.67. Each station had 2 samples where the two dominant species comprised more than 70% of the total population. Neither the dissolved N nor dissolved P concentrations were excessively high, although in the 2001-2003 period average total P concentrations were less than optimal, but were in the optimal range (< 0.3 mg/L) when monitored in 2011-2012. Total N concentrations all appear to be in the optimal range (< 1 mg/L). Although the populations were occasionally dominated by Chironomidae, there is a fair diversity of organisms at the downstream station, with greater diversity and a greater number of sensitive species at the upstream station.
Benthic Habitat Metrics Optimal Sub-optimal
Evidence for Organic Matter Abundant benthic organisms found in many of the samples – Hydropsychidae and Chironomidae – typical of organic-enriched sites. Low values of the Modified Family Biotic Index (MFBI) metric scores (>5.50) occurred in 6 of the 9 samples at 1BHPY001.29 and in 0 of the 8 samples at 1BHPY002.67. Low values of the shredder/filterer-collector ratio (< 0.5) occurred in all 9 samples at 1BHPY001.29 and in 6 of the 8 samples at 1BHPY002.67. Additionally two very pollutant-tolerant species were dominant in 7 of the 9 samples at station 1BHPY001.29, including one sample with a dominant population of Tubificidae, an organism indicative of raw sewage.
Hydrologic Modifications Happy Creek runs through the middle of the town of Front Royal. Happy Creek is intersected by 21 road crossings and two railroad crossings that constrict channel movement and contribute to scouring downstream of these structures. There are several in-stream impoundments along the Sloan Creek tributary and in the upper reaches of Happy Creek which will affect hydrology. Increased degree of impervious surfaces in the urban areas.
Sediment-Related Data DEQ Ambient Data • FOSR Ambient Data
More Sediment Data DEQ Biologist Assessment • Bedrock, sand, and fines are worst substrates for benthic habitat • LRBS indicates relatively stable bed at both sites (Optimal: > -0.5; Sub-optimal: < -1.0) • Relatively steep slope results in efficient transport of sediment from upstream channel erosion • Assessment of benthic impairment due to habitat problems is unclear
Evidence for Sediment Poor habitat metric scores for riparian vegetative protection: all samples at the downstream 1BHPY001.29 site and in 5 of the 8 samples at the upstream site. Anecdotal evidence points to crowds of fishermen competing for fishing spots the mornings after the creek is stocked, possibly contributing to poor riparian vegetation in some spots. Poor bank stability scores in half of the samples at the upstream 1BHPY002.67 site. Although, as is typically the case, there were no large ambient concentrations of TSS or turbidity, as sediment is rarely monitored during storm events. The LRBS siltation index score was -0.82 at the downstream site (moderately excessive sediment from anthropogenic sources); while the upstream site had two LRBS scores in 2008 and 2012 in the range of -0.22 to -0.23, indicating minimal anthropogenic influence.
Next Steps • Finalize stressor analysis • Identify reference watershed(s) • Obtain feedback on land use modeling assumptions • Conduct pollutant modeling • Develop TMDL
Contact Information Gene Yagow Biological Systems Engr. Dept. 306 Seitz Hall (0303)Virginia TechBlacksburg, VA 24061 eyagow@vt.edu540-231-2538 ftp://bsesrv214bse.vt.edu/Yagow/ShenandoahTribs/