Download
1 / 12
120 likes | 250 Vues
Dynamic Digital Elevation Model DDEM. NSF RII Track 2 Annual Meeting May 29 , 2012. What is a DDEM. model grid for all of the catchment to coast modeling experiments must be accurate and dynamic

E N D
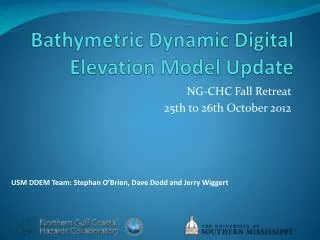
Dynamic Digital Elevation ModelDDEM NSF RII Track 2 Annual Meeting May 29, 2012
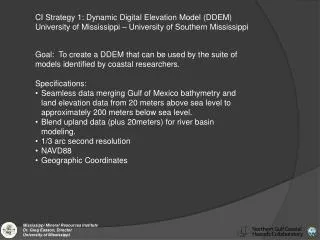
What is a DDEM • model grid for all of the catchment to coast modeling experiments • must be accurate and dynamic • dynamic nature means that it must support a wide range of model parameters and retain accuracy • must include the most recent additions of land surface elevation and bathymetry data
DDEM Requirements from Modelers • Seamless terrain model from 20 meters above MSL to 200 meters below MSF • X,Y,Z format in geographic coordinates • Zip file format • Bathymetry values expressed as negative • NAVD88 vertical datum • Resolution defined by user during extraction
Access and UseRequirements from Modelers • System to extract data from server, linked through NG-CHC collaborative environment • Extraction system • User selected Area of Interest (AOI) • Different data set characteristics displayed • User selected resolution • NO ‘smoothing’ of data • FTP download
Access and UseRequirements from Modelers • Modelers can upload new data for incorporation into DDEM • Footprint of new data retain • Data is deleted • Upload limits being determined • Differences between new and old data calculated and display to user
Deliverables – Year #2 • DDEM for Mississippi and Alabama • Documentation of procedures, issues and solutions • Plan for creation of DDEM for MS-AL-LA • System to extract selected areas of DDEM for use in models • Available for testing in MS & AL • Optimization methods being investigated
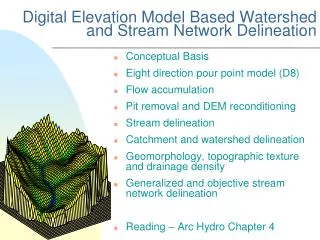
Creating the DDEM for MS & AL •Download the data from online data sources •Mosaic data into larger sections •Trim the land-based data to the coastline •Clip high resolution data to the county level •Create footprint file showing data coverage of differing resolutions
Coastline-trimmed 1/3 arc sec. NED data overlaying 1/3 arc sec. NOAA VDatum DEM
Harrison County, MS 1/9 arc sec. NED data shoreline-trimmed and clipped to the county level The red line represents the footprint of the DEM data
Footprint representing areal extent of three resolutions of data
Approximate area of anticipated data coverage for northern Gulf Coast
Next Steps – Year 3 • Complete development of DDEM for entire study area • Need more detailed information from simulation experiments • s