Download
1 / 11
130 likes | 152 Vues
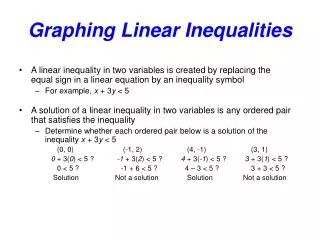
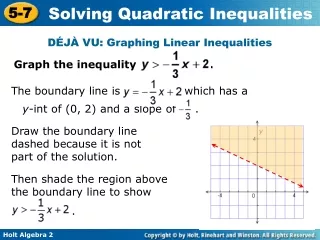
Graphing Linear Inequalities. First pretend it’s =. If you have an inequality like 2x + 3y > 6 First figure out how to graph 2x + 3y = 6 These are easiest to do if you solve for y. Remember the slope-intercept equation of a line. y = mx + b In this equation b = 2 and m =.

E N D
First pretend it’s = • If you have an inequality like 2x + 3y > 6 • First figure out how to graph 2x + 3y = 6 • These are easiest to do if you solve for y
Remember the slope-intercept equation of a line. y = mx + b In this equation b = 2 and m =
Dashed or solid? Now that you’re ready to draw the line, you have to decide if you want a dashed line ------- or a solid line . You are going to be coloring in an entire area of the plane. If the line is solid, it means that the points on the line are included in the set of points that “work” – that make the inequality true. If the line is dashed – then it is just the border separating the points that “work” from those that don’t. The points on the line are not included.
Memory trick If you have used the extra pencil lead to draw an equal sign under the inequality sign Use the extra pencil lead to make a solid line!
Let’s get graphing! Start at +2 on the y-axis (b) Then go down 2 (m is negative) and over 3
Above or below? If you began by solving for y, this trick will always work. y > shade above the line (greater than) y < shade below the line (less than)
Test point To be sure that you did it correctly, pick an easy test point. I always use ( 0, 0 ) unless it’s on the line. Substitute into the inequality. If you get a true statement, ( 0, 0 ) should be in the shaded area. If you get a false statement, ( 0, 0 ) should be in the unshaded area.
How’d we do? 2x + 3y > 6 0 + 0 > 6 0 > 6 NOT! ( 0, 0 ) should be in the unshaded area. HOORAY!
Graphing linear inequalities • Solve for y • If there’s an equal sign under the inequality, graph a solid line. • If there’s NO equal sign under the inequality, graph a dashed line. • y > shade above y < shade below • Use a test point to check your work.