Download
1 / 9
90 likes | 251 Vues
NORTHEAST Region. Regional Composite. REGIONAL DATA REPORT JAN – MAR 2013 vs. 2012. Methodology. Sales and Market Data is obtained using CAST (Category Avocado Sales Trend) IRI gathers chain-wide sales across all RMAs (Retail Market Areas)

E N D
NORTHEAST Region Regional Composite REGIONAL DATA REPORT JAN – MAR 2013 vs. 2012
Methodology • Sales and Market Data is obtained using CAST (Category Avocado Sales Trend) • IRI gathers chain-wide sales across all RMAs (Retail Market Areas) • Starting in 2013, the IRI Regions reflect an expanded retail data set which includes sales and volume from Walmart, Sam’s Club, Target and BJ’s, in addition to traditional grocery retailers • Data is entered into CAST system • Using CAST, data is queried and reported approximately every 4 weeks • Average Selling Price (ASP) is not Advertised Retail Price • Average selling price is the average of all prices including coupons, promotional pricing, club/loyalty card deals that are given at the register at the time of purchase • Categories: Total Avocados, Fruit = Total Fruit excluding Avocados, Produce = Total Produce including Avocados • Timeframe: YTD Q1 (January – March) 2013 • Retail data provided by IRI / FreshLook Marketing • Important Note: IRI / FreshLook Marketing periodically restates retail data, therefore this review cannot be compared or used in conjunction with prior reviews
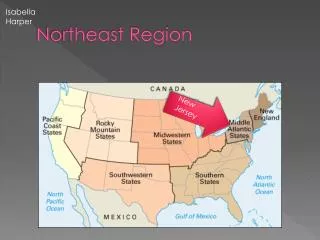
Northeast: Region Highlights - YTD Q1 • Overview based on the following geography: • The Northeast Region captures the Markets of Albany, Boston, Buffalo, Harrisburg/Scranton, Hartford/Springfield, New England, New York, Philadelphia and Pittsburgh, plus additional cities not included in Markets • Northeast Overview • Avocado retail dollar average trends through Q1 outpaced Fruit and Produce retail dollar trends • Category dollars grew +13% in 2012 and +22% in 2013 for a net growth of +38% over 2011 • Category units grew +25% in 2012 and +29% in 2013 for a net growth +61% over 2011 • Category average selling price (ASP) decreased -10% in 2012 and -6% in 2013 to $1.19/unit • Northeast Per Store Averages • 2013 Average dollars of $3,567 per store were +19% higher than 2012 and +30% higher than 2011 • 2013 Average units of 2,988 per store were +26% higher than 2012 and +52% higher than 2011 • Northeast versus Total U.S. trends • NE category unit growth of +29% was +12 points higher than the national average • NE category dollar trend of +22% was +8 points higher than the national average • NE 2013 category ASP of $1.19/unit was +26% higher than the national average of $0.95/unit
Northeast: YTD Q1 Retail Dollar Trend ComparisonsAvocados vs. Fruit vs. Produce • Avocado retail dollar trends through Q1 outpaced Fruit and Produce retail dollar trends • 2012 versus 2011, Avocados outpaced Fruit by +15 points and Produce by +14 points • 2013 versus 2012, Avocados outpaced both Fruit and Produce by +15 points • 2013 versus 2011, Avocado dollars grew +38% which outpaced both Fruit and Produce by +32 points
Northeast: YTD Q1 Avocado Retail Overview Category dollars grew +13% in 2012 and +22% in 2013 for a net growth of +38% over 2011 Category units grew +25% in 2012 and +29% in 2013 for a net growth +61% over 2011 Category average selling price (ASP) decreased -10% in 2012 and -6% in 2013 to $1.19/unit
Northeast vs. Total U.S.YTD Q1 PLU Comparisons • NE category unit growth of +29% was +12 points higher than the national average • NE growth was primarily driven by PLU 4225, Other and Bagged Avocados, which collectively grew +9 million units • NE category dollar trend of +22% was +8 points higher than the national average • NE growth was primarily driven by PLU 4225, Other and Bagged Avocados, which collectively grew +$9 million dollars • NE 2013 category ASP of $1.19/unit was +26% higher than the national average of $0.95/unit
Northeast: YTD Q1 Category Per Store Averages • In 2013, per store dollar and unit averages exhibited growth over the prior years • 2013 Average dollars of $3,567 per store were +19% higher than 2012 and +30% higher than 2011 • 2013 Average units of 2,988 per store were +26% higher than 2012 and +52% higher than 2011
Northeast: 2011 through Q1-2013 Per Store AveragesBy Quarter - Units vs. ASP • Average Retail Units Per Store • The peak quarter was 2013-Q1 at 2,988 units per store when ASP was $1.19/unit • The lowest quarter was 2011-Q4 at 1,688 units per store when ASP was $1.39/unit • ASP • Lowest ASP to date occurred during 2013-Q1, $1.19/unit • Highest ASP to date occurred during 2011-Q3, $1.83/unit
Northeast: Region Highlights - YTD Q1 • Overview based on the following geography: • The Northeast Region captures the Markets of Albany, Boston, Buffalo, Harrisburg/Scranton, Hartford/Springfield, New England, New York, Philadelphia and Pittsburgh, plus additional cities not included in Markets • Northeast Overview • Avocado retail dollar average trends through Q1 outpaced Fruit and Produce retail dollar trends • Category dollars grew +13% in 2012 and +22% in 2013 for a net growth of +38% over 2011 • Category units grew +25% in 2012 and +29% in 2013 for a net growth +61% over 2011 • Category average selling price (ASP) decreased -10% in 2012 and -6% in 2013 to $1.19/unit • Northeast Per Store Averages • 2013 Average dollars of $3,567 per store were +19% higher than 2012 and +30% higher than 2011 • 2013 Average units of 2,988 per store were +26% higher than 2012 and +52% higher than 2011 • Northeast versus Total U.S. trends • NE category unit growth of +29% was +12 points higher than the national average • NE category dollar trend of +22% was +8 points higher than the national average • NE 2013 category ASP of $1.19/unit was +26% higher than the national average of $0.95/unit