Download
1 / 2
20 likes | 74 Vues
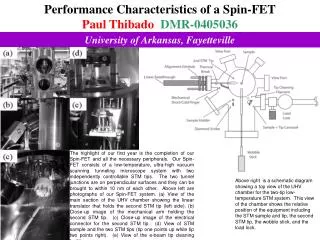
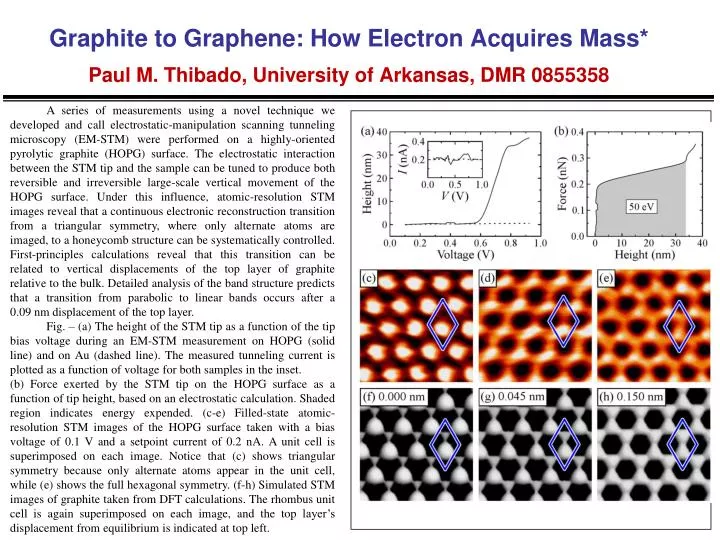
Graphite to Graphene: How Electron Acquires Mass* Paul M. Thibado , University of Arkansas, DMR 0855358.

E N D
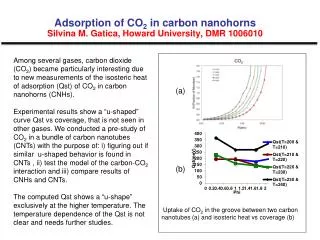
Graphite to Graphene: How Electron Acquires Mass*Paul M. Thibado, University of Arkansas, DMR 0855358 A series of measurements using a novel technique we developed and call electrostatic-manipulation scanning tunneling microscopy (EM-STM) were performed on a highly-oriented pyrolytic graphite (HOPG) surface. The electrostatic interaction between the STM tip and the sample can be tuned to produce both reversible and irreversible large-scale vertical movement of the HOPG surface. Under this influence, atomic-resolution STM images reveal that a continuous electronic reconstruction transition from a triangular symmetry, where only alternate atoms are imaged, to a honeycomb structure can be systematically controlled. First-principles calculations reveal that this transition can be related to vertical displacements of the top layer of graphite relative to the bulk. Detailed analysis of the band structure predicts that a transition from parabolic to linear bands occurs after a 0.09 nm displacement of the top layer. Fig. – (a) The height of the STM tip as a function of the tip bias voltage during an EM-STM measurement on HOPG (solid line) and on Au (dashed line). The measured tunneling current is plotted as a function of voltage for both samples in the inset. (b) Force exerted by the STM tip on the HOPG surface as a function of tip height, based on an electrostatic calculation. Shaded region indicates energy expended. (c-e) Filled-state atomic-resolution STM images of the HOPG surface taken with a bias voltage of 0.1 V and a setpoint current of 0.2 nA. A unit cell is superimposed on each image. Notice that (c) shows triangular symmetry because only alternate atoms appear in the unit cell, while (e) shows the full hexagonal symmetry. (f-h) Simulated STM images of graphite taken from DFT calculations. The rhombus unit cell is again superimposed on each image, and the top layer’s displacement from equilibrium is indicated at top left.
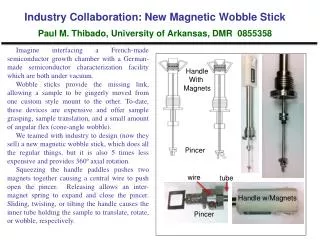
Co-Hosts of the 2011 AAPT-AOK ConferencePaul M. Thibado, University of Arkansas, DMR 0855358 This past year we helped co-host an American Association of Physics Teachers (AAPT) conference. It was for the local Arkansas, Oklahoma, and Kansas (AOK) chapter. The conference was primarily hosted by Northwest Arkansas Community College (NWACC) by Prof. Phillips (UARK Physics graduate). The theme of the conference was “Building Scientific Literacy in a Modern World.” Top Photo: Graduate student (facing camera) supported by this NSF grant (Matt Ackerman) is leading a tour of our lab to some of the conference attendees. Middle Photo: Conference attendee is looking at the low-temperature ultra-high vacuum scanning tunneling microscope (STM) facility in our lab. Bottom Photo: Conference attendee is looking through a low-magnification microscope at two things. First, an in-house, custom made ultra-sharp tungsten STM tip. Second, a 2000 mesh copper grid supporting freestanding graphene.