Download
1 / 19
190 likes | 303 Vues
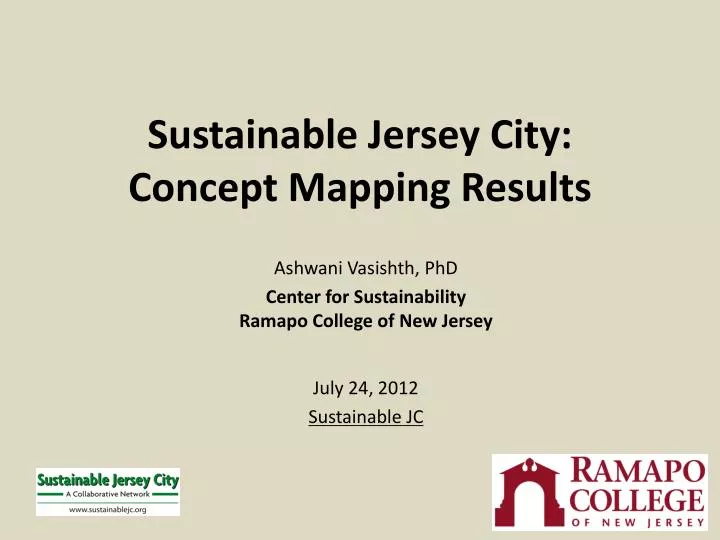
Sustainable Jersey City: Concept Mapping Results. Ashwani Vasishth, PhD Center for Sustainability Ramapo College of New Jersey July 24, 2012 Sustainable JC. Outline. - Sustainable Jersey City - Concept Mapping Process - 11-Cluster Analysis - Go Zone Statements. Concept Systems Software.

E N D
Sustainable Jersey City:Concept Mapping Results Ashwani Vasishth, PhD Center for SustainabilityRamapo College of New Jersey July 24, 2012 Sustainable JC
Outline - Sustainable Jersey City- Concept Mapping Process- 11-Cluster Analysis- Go Zone Statements
Concept Systems Software http://www.conceptsystems.com/
Concept Mapping Process • Assemble Savvy Stakeholders • Craft A Focus Prompt • Statement Generation • Rating, Sorting and Labeling • Cluster Mapping • Concept Mapping Analysis • Action Plan Generation
Focus Prompt “To help Jersey City move toward sustainability, neighborhood and community groups need to…” • A total of 71 statements were generated • These statements were rated for importance and for feasibility, and sorted into clusters by functional association. • The clusters were then labeled in a descriptive way, and the data fed into the Concept Mapping program.
2 40 16 30 1. Leadership development 6 24 34 1 8 22 35 17 20 6. The Future 41 33 10 39 37 5 60 2. How to work with other groups 15 21 7 7. Art 52 4 11 49 14 19 26 3. Participate in government 47 29 18 31 25 28 8. Working with Business 9. City working with Community and Business 9 23 27 66 67 58 53 3 45 57 10. Food and Nutrition 4. Municipal Policies, Advocacy 71 42 32 56 50 13 38 12 68 54 59 36 69 61 70 11. Open Space, Green Space, Street Trees, Biodiversity 5. Improve Mobility 48 64 65 51 55 63 62 46 43 44 11-Cluster Point Map
2 40 16 30 1. Leadership development 6 24 34 1 8 22 35 17 20 41 33 10 39 37 6. The Future 5 60 2. How to work with other groups 15 21 7 52 7. Art 4 11 49 14 3. Participate in government 19 26 47 29 18 31 25 9. City working with Community and Business 28 8. Working with Business 9 23 27 66 67 58 53 3 45 57 10. Food and Nutrition 4. Municipal Policies, Advocacy 71 42 32 56 50 13 38 12 68 54 59 36 69 61 70 11. Open Space, Green Space, Street Trees, Biodiversity 48 5. Improve Mobility 64 65 51 55 63 62 46 43 44 11-Cluster Rating Map: Importance
2 40 16 30 1. Leadership development 6 24 34 1 8 22 35 17 20 41 6. The Future 33 10 39 37 5 60 2. How to work with other groups 15 21 7 52 7. Art 4 11 49 14 19 26 3. Participate in government 47 29 18 31 25 28 8. Working with Business 9. City working with Community and Business 9 23 27 66 67 58 53 3 45 57 10. Food and Nutrition 4. Municipal Policies, Advocacy 71 42 32 56 50 13 38 12 68 54 59 36 69 61 70 11. Open Space, Green Space, Street Trees, Biodiversity 48 5. Improve Mobility 64 65 51 55 63 62 46 43 44 11-Cluster Rating Map: Feasibility
2 40 16 1. Leadership development 30 6 24 34 1 8 22 35 17 20 41 33 10 39 37 5 6. The Future 60 2. How to work with other groups 15 21 7 52 7. Art 4 11 49 14 3. Participate in government 19 26 47 29 18 31 25 8. Working with Business 28 9. City working with Community and Business 9 23 27 66 58 67 53 3 45 10. Food and Nutrition 57 4. Municipal Policies, Advocacy 71 42 32 56 50 13 38 12 68 54 59 36 69 61 11. Open Space, Green Space, Street Trees, Biodiversity 70 5. Improve Mobility 48 64 65 51 55 63 62 46 43 44 11-Cluster Point Rating Map: Importance
2 40 16 1. Leadership development 30 6 24 34 1 8 22 35 17 20 41 33 10 39 37 5 6. The Future 60 2. How to work with other groups 15 21 7 52 4 7. Art 11 49 14 19 26 3. Participate in government 47 29 18 31 25 28 8. Working with Business 9. City working with Community and Business 9 23 27 66 67 58 53 3 45 10. Food and Nutrition 57 4. Municipal Policies, Advocacy 71 42 32 56 50 13 38 12 68 54 59 36 69 61 11. Open Space, Green Space, Street Trees, Biodiversity 70 5. Improve Mobility 48 64 65 51 55 63 62 46 43 44 11-Cluster Point Rating Map: Feasibility
3.41 3.45 The Future City working with Community and Business Working with Business Leadership development Food and Nutrition Art Open Space, Green Space, Street Trees, Biodiversity How to work with other groups Art Municipal Policies, Advocacy Participate in government Working with Business Municipal Policies, Advocacy Improve Mobility The Future How to work with other groups Participate in government Food and Nutrition Leadership development Open Space, Green Space, Street Trees, Biodiversity City working with Community and Business Improve Mobility r = -.51 3.03 2.47 Importance Feasibility Pattern Matching Analysis
r = .47 3.71 28 66 6 52 11 23 65 7 4 2 21 53 25 1 33 64 56 54 67 27 38 8 57 63 3 32 60 68 20 49 13 15 69 29 61 2.72 51 10 34 26 24 50 22 47 9 55 70 46 5 40 31 58 36 19 17 45 Feasibility 44 35 37 39 41 43 42 62 18 71 14 59 30 16 12 48 1.44 2.41 3.27 3.88 Importance Go Zone Analysis
Questions? Ashwani Vasishth, PhD Center for Sustainability Studies Ramapo College of New Jersey vasishth@ramapo.edu Debra Italiano Sustainable Jersey City 917-447-9839 dai@debraitaliano.com