Download
1 / 96
1.44k likes | 2.54k Vues
Value Stream Mapping. Defining the Value Stream. Your Time to Relax. Value Stream. Value Stream: The flow of materials and information through a process to provide a product or service to a customer; including operations and equipment needed. Value Stream Mapping.

E N D
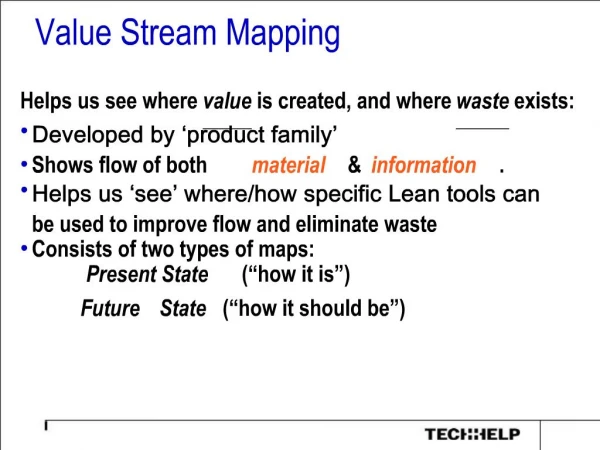
Value Stream Mapping Defining the Value Stream
Value Stream Value Stream: The flow of materials and information through a process to provide a product or service to a customer; including operations and equipment needed.
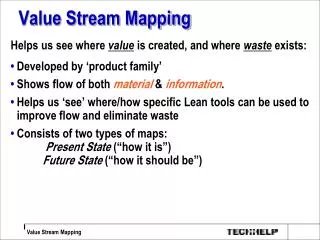
Value Stream Mapping Value Stream Mapping: Involves walking and drawing the processing steps (material and information) for one product/service family from door to door.
Systems Approach Value Stream A Value Stream B Value Stream C
Benefits of Value Stream Mapping • VSM allows you to see beyond the single process step and see process flow. • VSM allows you to see sources of waste in the value stream. • VSM provides a common language to discuss issues. • VSM links lean concepts and techniques. • VSM provides a blueprint for improvement.
Benefits of Value Stream Mapping • VSM shows the linkage between information flow and material flow. • VSM makes decisions regarding flow apparent. • VSM is both a quantitative and qualitative tool, with the qualitative being most significant.
Consider…. ….what benefits might be realized within your organization using Value Stream Mapping?
VSM Uses • Project planning and reporting • High level strategizing • Aligning improvements with strategic plan • Training (visual aids) • Patient education • Explaining procedures to patients
VSM Uses • Demonstrating/documenting improvements to regulatory agencies • Communicating change between departments • Initiating new policies • Replacing or augmenting policy manuals
Value Stream Mapping Value Stream Mapping Process
Flow Chart versus VSM Flow Charting • Visual representation of process • Generally localized within functional area • Identifies process steps Value Stream Mapping • Visual supplemented with selected process data • Crosses functional boundaries (door to door) • Illustrates process steps and information flow
Product/Service Flow Information Product/Service Flow Material
Value Stream Manager Value Stream Manager: In an organization structure designed most fully to reflect lean philosophy, all the support groups related to making a value stream operate would report on a solid line to Value Stream Manager.
Value Stream Manager Approach Value Stream A VSM A Value Stream B VSM B Value Stream C VSM C
VSM Job Description • Reports lean implementation progress to top person on site • Person with capability of making change across functional and departmental boundaries • Leads the creation of current state and future state maps and implementation plans • Monitors all aspects of implementation
VSM Job Description • Walks and checks the flow of the value stream daily or weekly • Makes implementation a top priority • Maintains and periodically updates the implementation plan • Insists on being a hands on person
Two Kaizens Senior Management. Flow Kaizen (Value Stream Improvement) Process Kaizen (Elimination of Waste) Task Level Focus
VSM Steps Product/Service Family Current State Drawing Future State Drawing Implementation Plan
Value Stream Mapping Current State Map
Four Levels of Mapping Process Level Single Facility (Door to Door) Multiple Facilities Across Companies
Mapping Tips • Collect current state information while walking the actual pathway of material and information flow • Begin with a quick walk along the entire door-to-door value stream • Begin at discharge and work upstream • Bring your stopwatch and do not rely on standard times • Map the whole process yourself • Confirm observations with task experts
One Final Tip Draw by hand with a pencil …can be done without delay …allows task expert ability to do the mapping …focuses on understanding of material and information flow, rather than how to use computer
Questions to Ask • Is it clear what should happen, in what order, and is there an approximate time frame for completion? • Is every step in the current process adding value to the patient? • Is the participation of every person that touches the process necessary? • Does everyone do the process the same way?
Questions to Ask • How does new worker learn the process? • How did you learn the process? • About how long should it take to complete the process? • Is the expected outcome clearly understood? • What is the expected outcome?
Lean Definitions Takt Time: literally the “beat” of the process, it is the pace of production or service based on customer consumption.
Lean Definitions Cycle Time: total amount of elapsed time from the time a task, process or service is started until it is completed C/T
Lean Definitions Value-Creating Time: time of work element that actually transforms product or service in a way that the customer is willing to pay for VCT
Lean Definitions Lead Time: time it takes one product or delivery of service to move all the way through the value stream from start to finish L/T
Your Data and Your Assignment • Determine the source of process data needed • Develop a plan to collect the data • Bring the data with you to the next session
Three Zones of VSM • Upper Third-Information Flow • Middle Third-Process Flow • Bottom Third-Process Data • Maximum, minimum, and average process time • Value added time • Non-value added time
Step #1 Begin with the Customer Cardiac Patient
Step #1-Add Customer Requirements Cardiac Patient Immediate attention Accurate diagnosis Appropriate treatment
Step #2-Process Steps Add Process Steps, Data Boxes, Task Experts, Delay and Inventory Triangles across the bottom Check in RN Consult MD Consult I I D C/T= C/O= VCT= Uptime= Seconds available= C/T= C/O= VCT= Uptime= Seconds available= C/T= C/O= VCT= Uptime= Seconds available=
Step #3-Add Material Flow Check in RN Consult MD Consult I I D C/T= C/O= VCT= Uptime= Seconds available= C/T= C/O= VCT= Uptime= Seconds available= C/T= C/O= VCT= Uptime= Seconds available=
Step #4-AddInformation Flow Check in RN Consult MD Consult I I D C/T= C/O= VCT= Uptime= Seconds available= C/T= C/O= VCT= Uptime= Seconds available= C/T= C/O= VCT= Uptime= Seconds available=
Step #4-Add Push Arrows Check in RN Consult MD Consult I I D C/T= C/O= Uptime= Seconds available= C/T= C/O= Uptime= Seconds available= C/T= C/O= Uptime= Seconds available=
Step #5-Add Timeline Check in RN Consult MD Consult I I D C/T= C/O= Uptime= Seconds available= C/T= C/O= Uptime= Seconds available= C/T= C/O= Uptime= Seconds available=
Practice Time Working in table groups create a Current State Value Stream Map for a Value Stream in your organization
Value Stream Mapping Lean Value Stream
Lean Value Stream Goal …All we are trying to do in lean value stream is to get one process to deliver product or service to the customer in the most efficient way possible …We are trying to link all processes-from the final customer back upstream in a smooth flow without detours that generates the shortest lead time, highest quality, and lowest cost.
Sources of Waste (Muda) • Transport (Conveyance) • Inventory • Motion (Movement) • Waiting (Delay) • Overproduction • Over-processing • Defects (Correction, Repair, Rejects) Which source is costing you the most?
Timeline and Waste Check in RN Consult MD Consult I I D C/T= C/O= Uptime= Seconds available= C/T= C/O= Uptime= Seconds available= C/T= C/O= Uptime= Seconds available=
Sources of Waste (Muda) Review your current state value stream map. Label areas of waste. Which source is costing you the most?
The Goal Is….. • Old paradigm: • Cost + Profit = Price • New paradigm: • Price (fixed) – Cost = Profit • Key to profitability: • Cost reduction Fixed Price
Consider…. …how are costs established in your organization? …how is waste impacting cost to your organization?
Cost Dollars of Output Cost= Dollars of Input