Download

1 / 19
210 likes | 505 Vues
Value Stream Mapping. Dr. Richard E. White. Overview. VSM Key Tool in Continuous Improvement Understanding What the Customer Values Muda Current State Future State. VSM. VSM Key Tool in Continuous Improvement Graphical Representation of Value Stream

E N D
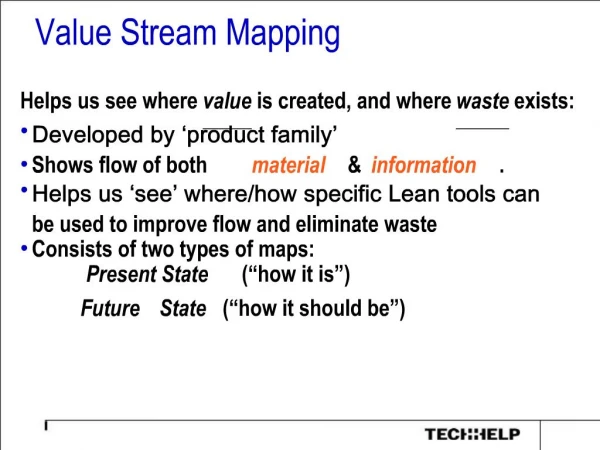
Value StreamMapping Dr. Richard E. White
Overview • VSM Key Tool in Continuous Improvement • Understanding What the Customer Values • Muda • Current State • Future State
VSM • VSM Key Tool in Continuous Improvement • Graphical Representation of Value Stream • Flow of Materials and Information Through Transformation to Deliver Product/Service to Customer • VSM has an Enterprise Focus rather than a Functional Focus
Five Principles of Lean 1.) Value 2.) The Value Stream 3.) Flow 4.) Pull 5.) Perfection
Muda • Waste • Type-1 muda non-value added but deemed necessary • Type-2 muda non-value added and unnecessary
VSM Current State • Identify VSM Team • Leader • Assembled Team • Data Collection • Identify Major Process Steps • Quantify the Process
VSM Current State (cont.) • Decide Value added and Non-Value Added Activities • Estimate Times • Sum the Individual Times • Review Process • Quantify Overall Lead Times
VSM Current State (cont.) • Determine the Information Flow • Validate the VSM
VSM Information Typically Collected for Current State • The end customer’s requirements • Customer’s schedules • Cycle time or processing time • Changeover time • Reliability of equipment • Quality yield information
VSM Information Typically Collected for Current State (cont.) • Quantities – (batch sizes) • Number of operators & shifts • Hard copies of information • Inventory levels • Queue or waiting time • Information flow
VSM Icons • Dedicated process • Shared process • Customer/supplier • Data box • Work cell http://www.strategosnic.com/value-stream-mapping-3.htm
VSM Icons • Inventory • Shipments • Material push • Supermarket • Material pull http://www.strategosnic.com/value-stream-mapping-3.htm
VSM Icons • Safety stock • External shipment • Manual information • Electronic information • Production Kanban http://www.strategosnic.com/value-stream-mapping-3.htm
VSM Icons • Withdrawal Kanban • Kaizen Burst • Operator • Timeline • Information http://www.strategosnic.com/value-stream-mapping-3.htm
VSM Future State • Analyze Your Current State VSM • Start With Your Customer’s View • Identify Issues in the Value Stream that Affect the Customer • Quantify Customer Demand Rate (takt Time) • Identify Where Flow is Less than Ideal
VSM Future State (cont.) • Blockages Can be Traced to Muda • Remove Blockages • Look for Muda, Mura, and Muri • Consider two future views • Future State • Incremental Improvement State
VSM Future State (cont.) • Update the Current State VSM to Reflect the New Current State • Compare the New Current State to the Future State • Start Mapping Again
Press Paint Final Ass Blanking Dispatch Press Weekly Schedules Daily Schedules C/O = 15 min C/T = 0.2 sec C/O = 30 min C/T = 2 sec C/O = 5 min C/T = 3.5 min C/O = nil C/T = 90 min (v/a) = 3 min C/O = nil C/T = 1 min Aylesbury Pressings: Current State(Steering Bracket) Level? Takt=2x420/170=5 min Shared resources shaded Six Monthly and Monthly Forecasts Monthly forecasts Production Control MRPII Weekly Requirement Which most reliable? Weekly orders Customer Daily call off Supplier Frequency? total l/time=18695 min V add time = 650 sec Responsive? some kanban coils inventory 500 Rework/ quality Inventory changeover sequence OEE issues 623 Transport inventory Assemble imbalance VA time vs Cycle time 35 200 1780 13 nil 324 (Progression line) 16 nil 230 2074 3115m 0m 90m 1000m 2500min 10370m 1620m 60 s 2 sec 0.2 sec 180s 218s
Staging Weekly Schedules Daily Schedules C/O = nil C/T = 18 sec. 57,600 sec. avail. C/O = 15 min C/T = 12 sec. 57,600 sec. avail C/O = 15 min C/T = 10 sec 57,600 sec. avail C/O = nil C/T = 36.0 sec. 57,600. avail C/O = 30 min C/T = 7 sec. 57,600 sec. avail Allied Product’s Partner: Current State(Wine Box - Top Plate) Takt=57,600 sec./3,200=18 sec. Shared resources shaded Six Monthly and Monthly Forecasts Monthly forecasts Production Control MRPII Weekly Requirement Weekly orders Customer Daily call off Supplier total time= 18 hrs. 22 min. V add time = 1 min. 18 sec. wood Dispatch truckload 2 days 4000 foil nails nails Final Assy Rip Saw Cross-Cut Brand Sub Assy 42 42 42 42 16 hrs 8 min. 24 sec. 7 min. 96 min. 25 min. 12 sec. 4 min. 54 sec. 10 sec 12 sec 7 sec 36 sec 18 sec