Download
1 / 43
470 likes | 774 Vues
Value Stream Mapping. An effective way of capturing the current situation, identifying the long-term lean vision, and developing a plan to get there. The journey toward lean manufacturing. For a journey, you must know: Destination Starting point

E N D
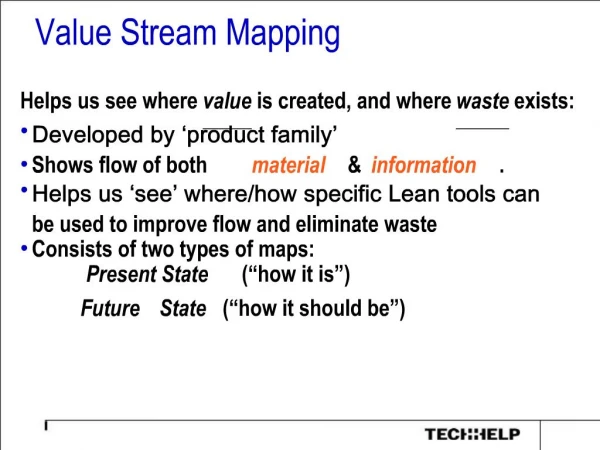
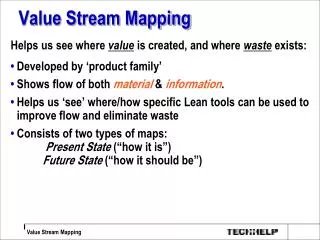
Value Stream Mapping An effective way of capturing the current situation, identifying the long-term lean vision, and developing a plan to get there. Ch-6 Value Stream Mapping
The journey toward lean manufacturing For a journey, you must know: Destination Starting point For the journey toward lean manufacturing The destination (vision) The starting point (current state mapping). Ch-6 Value Stream Mapping
Value Stream Mapping • Examines and records all activities From raw material to a finished product. Both value added and non-value added activity • Captures the current situation (current state) • Identifies the long-term lean vision (future state) • Develops a plan to get there. Find the “true north” Ch-6 Value Stream Mapping
Value Stream Mapping • Learns to “see”“The problem is not elimination of waste, but identification of waste. Any reasonable person will eliminate waste if he can only see it in the first place.” --- Shigeo ShingoMany companies don’t see“hear no evil, speak no evil, see no evil.” • Continues improvement Ch-6 Value Stream Mapping
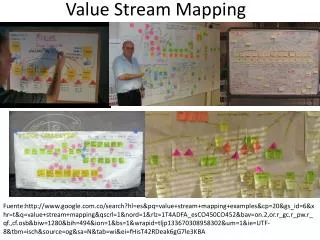
An example of current state mapping Ch-6 Value Stream Mapping
Current state mapping (CSM) • A graphic depiction of what is currently happening on the floor • Should be conducted by a cross-functional team of people. • Data must be gathered from existing conditions on the floor, not data stored on someone’s computer. To gather the information, the cross functional mapping team must walk the floor, door-to-door, following the product as it is manufactured. CSM is a pencil-and-paper process intended to get employees involved, as well as gain a better, more intimate understanding of the product, process, and information flow. Resist the urge to use a computer for this process. Ch-6 Value Stream Mapping
Current state mapping (CSM) CSM maps three flows: Product flow the path(s) the product takes through production, before being shipped to the customer. Information flow how information is shared and communicated during the production process. Material flow how incoming material is moved and replenished, and in what quantities during production. Ch-6 Value Stream Mapping
Current state mapping (CSM) The information to be gathered from the shop floor: • Run ratios — the available time divided by the number of good parts; • Scrap rates — the number of parts produced that are not salvageable; • Manpower — the number of operators in the process (actual versus required); • Work hours and schedules — the number of hours available per day, the number of shifts per day, and the number of shifts per week; • Changeover times — the amount of time it takes to change from product to product, from the last good part to the first good part; Ch-6 Value Stream Mapping
Current state mapping (CSM) • Tool change times — the amount of time required to change tooling, from the last good part to the first good part; • Machine cycle times — the actual cycle time of each machine, from home to home; • Inventory levels—the amount and location of all parts, including raw materials and finished goods. • Additional measures to record Ch-6 Value Stream Mapping
Current state mapping (CSM) Summary Irrespective of metrics, sum up the process in anecdotal terms. How is flow? How is pull? How is visual? What wastes? headaches? Inconsistencies? What best practices (or lack thereof)? Ch-6 Value Stream Mapping
Icons to Be Used Factory icon The customer’s assembly plant is represented by a factory icon in the upper right-hand corner. Data box recording the requirements of the customer. Process/Department box. Write key information within the data box, such as cycle time, changeover time, and uptime. Inventory This is indicated with triangles to indicate “dead” flow Ch-6 Value Stream Mapping
Icons to Be Used Movement The truck icon and a broad arrow to show movement of material from the supplier to the plant. Production information The process operators know what to make and in what quantity. And what to purchase. Ch-6 Value Stream Mapping
Example 1 XYZ Assembly operates on two shifts and requires daily shipments. Typically, 6,000 A units, 2,000 B units, 4,000 C units, and 8,000 D units are needed every month. XYZ requests are palletized returnable trays, with 20 brackets in a tray and up to 10 trays on a pallet. Ch-6 Value Stream Mapping
Current State Map of Case Study Example Ch-6 Value Stream Mapping
Step 1: Begin with the customer’s requirements To be drawn in the upper right-hand corner. Ch-6 Value Stream Mapping
Step 2: Draw the basic production processes and count the inventories Ch-6 Value Stream Mapping
Step 3: Add Supplier(s) Ch-6 Value Stream Mapping
Step 4: Add Information Flow Ch-6 Value Stream Mapping
Step 5: Add Lead Time Ch-6 Value Stream Mapping
Analyze the Current State Many symptoms of mass production All processes in the value stream receive a schedule from production control ---------- “push system” Independent Efficiency The traditional mass approach is to attain maximum utilization of equipment, manpower, and materials in the following order of descending priority: equipment, manpower, and materials. For Toyota, if anything, the order should be reversed. Toyota coordinates the three to increase efficiency-----Toyota’s “total efficiency” Ch-6 Value Stream Mapping
Analyze the Current State Waste of Overproduction • Work-in-process accumulates after each machine and each process. • Material handling between processes is two or more times what it should be. • There is poor response to changes in specifications or in products. • There are extremely long production lead times. • The workflow and production sequences cannot be standardized. Waste of Correction (Rework Parts) Ch-6 Value Stream Mapping
Analyze the Current State Inflexibility The current state data in Figure 4-1 shows the machining changeover takes one hour, and the assembly process takes 10 minutes. This indicates that there is little flexibility in product changeover. Changeover time is an important issue with processes that produce a number of different parts. Lower Process Uptime CSM identifies significant amounts of unplanned downtime in the machining lines. Causes for downtime need to be identified Ch-6 Value Stream Mapping
Analyze the Current State Intrinsic Fallout • Shop floor “specialists” spend time throughout each day counting work-in-process and raw materials to make sure they can meet their schedule. This is a people-dependent activity, not a process-dependent activity. • Shop floor operators and supervisors are not empowered to make daily decisions because the “schedule from above” will decide that for them. • There is a difficult level of housekeeping to sustain. The amount of waste to support the push system ties up resources that could otherwise be available to sustain the effort. Ch-6 Value Stream Mapping
Utilization Example 2: A work center is available 120 hours but actually produced goods for 100 hours. What is the utilization of the work center? Answer Utilization = 100 / 120 (100%) = 83.3% Ch-6 Value Stream Mapping
Efficiency Example 3: A work center produces 120 units in a shift. The standard for that item is 100 units a shift. What is the efficiency of the work center? Answer Efficiency = 120 / 100 (100%) = 120% Ch-6 Value Stream Mapping
Rated capacity Rated capacity is calculated bytaking into account the work center utilization and efficiency: Rated capacity = available time X utilization X efficiency Example 4: A work center consists of four machines and is operated eight hours per day for five days a week. Historically, the utilization has been 85% and the efficiency 110%. What is the rated capacity? Answer Available time = 4 X 8 X 5 = 160 hours per week Rated capacity = 160 x 0.85 X 1.10 = 149.6 standard hours. We expect to get 149.6 standard hours of work from that work center in an average week. Ch-6 Value Stream Mapping
Capacity required Hours of work required at each work center in each time period. Example 5: A work center is to process 150 units of gear shaft SG 123 on work order 333. The setup time is 1.5 hours, and the run time is 0.2 hours per piece. What is the standard time needed to run the order? Answer Total standard time = setup time + run time = 1.5 + (150 x 0.2) = 31.5 standard hours Ch-6 Value Stream Mapping
Capacity required Example 6: In the previous problem, how much actual time will be needed to run the order if the work center has an efficiency of 120% and a utilization of 80%? Answer Capacity required = (actual time)(efficiency)(utilization) =32.8 hours Ch-6 Value Stream Mapping
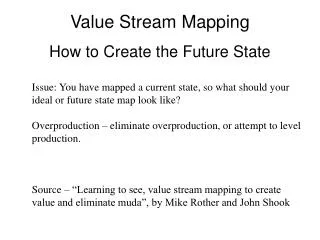
Creating The Future State Map Simple goal of lean manufacturing: Produce the highest quality at the lowest total cost in the shortest lead-time, with flexibility to respond to changes. Lead-time consists of non value-added time and value-added time. The challenge in developing the future state is to produce the customer’s requirements (within specification) in the shortest lead-time and at the lowest cost. Ch-6 Value Stream Mapping
Creating The Future State Map In the example 1 current state map (Figure 4-1), how to reduce the lead-time? The answer is to prevent overproduction. Three tools are used to prevent overproduction and reduce leadtime ---Takt time ---Kanban ---Load leveling Ch-6 Value Stream Mapping
Where Can One-piece Flow Processing Be Applied? • The largest cycle time in the line should be less than takt time. • The line should be balanced (The cycle times should be even). • Flexibility Ch-6 Value Stream Mapping
Is it necessary to replenish the pull? • If the manufacturer knows customer is withdrawing from the finished good’s marketplace, then a process needs to be established to replenish only what the customer is withdrawing. • Takt time was established. • The downstream process (assembly) is required to replenish the full range of products on a daily basis, so there must be a one-day marketplace for all products. Ch-6 Value Stream Mapping
Should Production Be Scheduled? • There is sufficient lead time from when the build signal is received to produce and deliver to the customer’s fitment point. • It is practical and possible to flow the product from this point forward. Ch-6 Value Stream Mapping
At which stations, are parts withdrawn? At which stations, are parts scheduled? Future State Map Ch-6 Value Stream Mapping
What Should be the Withdrawal Frequency of Finished Goods? In the example 1 of Figure 4-17, the daily requirements of products A, B, C, and D would look like this: A = 300/day B = 100/day C = 200/day D = 400/day Container quantity = 20 Therefore, the number of containers per day is: A = 15 B = 5 C = 10 D = 20 The withdraw interval = 840 minutes / 50 containers = 17 minutes Ch-6 Value Stream Mapping
Future State Map Ch-6 Value Stream Mapping
Future State Map • The FSM of Figure 4-18 shows: • The addition of load-leveling board. • The impact of the amount of FGs necessary to support the customer’s requirements if the withdrawal frequency was increased to four times per day. • A further 0.8 of a day of lead-time can be cut from the stream. Ch-6 Value Stream Mapping
Compare Current and Future • Where is the bottleneck? • What is the big system problem? • How can “push” be changed to “pull”? • Where are the key process kaizen opportunities? • What are the logistical, behavioral and policy barriers to reaching ideal? • What target is realistic for this improvement? Ch-6 Value Stream Mapping
Create An Action Plan 1. Background 2. Current Condition 3. Problems/Effects 4. Target Condition 5. Countermeasures/ Results 6. Key Measures 7. Timetable Ch-6 Value Stream Mapping
Timetable Draw a Gantt chart with major milestones for implementation of countermeasures. Ch-6 Value Stream Mapping
Carry Out The Plan 1 . Plan for air, electric, water, computer 2. Plan for safety 3. Start as soon as possible. Don’t wait for perfection. 4. Do it as a team. 5. Don’t spend money. Prove out the plan first. 6. Don’t be afraid to act. 7. Be prepared to make on the spot adjustments. Ch-6 Value Stream Mapping
Video Example Lathe Cutter Making Ch-6 Value Stream Mapping