Download
1 / 10
100 likes | 202 Vues
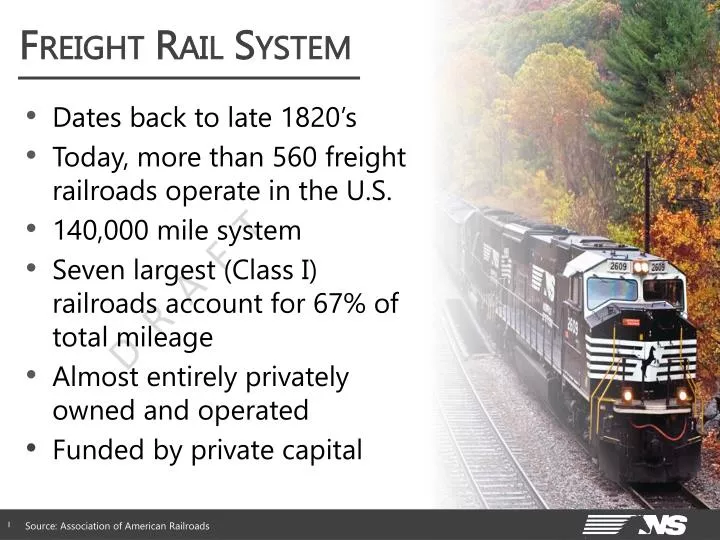
Coal Comparisons Third Quarter 2012 vs. 2011. Freight Rail System. Dates back to late 1820’s Today, more than 560 freight railroads operate in the U.S. 140,000 mile system Seven largest (Class I) railroads account for 67% of total mileage Almost entirely privately owned and operated

E N D
Coal Comparisons Third Quarter 2012 vs. 2011 Freight Rail System • Dates back to late 1820’s • Today, more than 560 freight railroads operate in the U.S. • 140,000 mile system • Seven largest (Class I) railroads account for 67% of total mileage • Almost entirely privately owned and operated • Funded by private capital 1 Source: Association of American Railroads 1
General Characteristics of U.S. Freight Railroads • Vast majority privately-owned, tax-paying firms • Same company usually owns the track and operates trains over it • No automatic access to another’s tracks • Little government funding • Don’t carry passengers • Regulation not as onerous as it once was, but still substantial (FRA for safety; STB for rates, service, etc.) 2 Source: Association of American Railroads
Environmental Steward • Moves a ton of freight 469 miles per gallon. • One train = hundreds of trucks. • 4 times more fuel efficient than trucks. • Reduces greenhouse gases by 75% compared with trucks. • Diverting 10% of long-distance truck traffic to rail would be like taking 2 million cars off the road or planting 280 million trees. 3 Source: Association of American Railroads
Highway Congestion Forecasted Daily Freight Truck Volume 2012 2035 Source: U.S. DOT 4
Key Factors Favorable to Rail • Highway congestion • Fuel efficiency • Driver availability and turnover, and aging truck fleet • Increasing cost structure for trucking • Focus on sustainability 5
Coal Comparisons Third Quarter 2012 vs. 2011 Norfolk Southern • Class I railroad • Safest railroad in North America • Winner of the E.H. Harriman Memorial Gold Medal Award for 23 consecutive years • Originator of more finished vehicles shipments than any other North American railroad • Largest Intermodal franchise in the eastern U.S. • Largest metals franchise of any Class I railroad • Annual Capital Investment $2 Billion 7 7
NS Business Mix in 2012 Volume Revenue 7.1 Million Units $11.0 Billion in Revenue 8
Coal Comparisons Third Quarter 2012 vs. 2011 Economic Development 101 • Sites and Buildings • Appropriate Infrastructure • Utility – Electric, Gas, Water, Sewer, Telecomm • Transportation – Highway, Rail, Port • Labor Force • Community Support • Tax Environment • Speed to Market 9 9
Coal Comparisons Third Quarter 2012 vs. 2011 Trends • Warehouse Logistics Parks • Intermodal Logistics • Private Sector Site Development • Foreign Direct Investment • Port Related Development • Energy Related Development • Ethanol • Shale Gas & Shale Oil • Coal • Petrochemical Projects 10 10