Download
1 / 3
30 likes | 73 Vues
-. L. R. T. 1000. 850. 400. 200. 1000. 400. 300. 200. Figure S1. -. L. T. L. bp. bp. A. B.

E N D
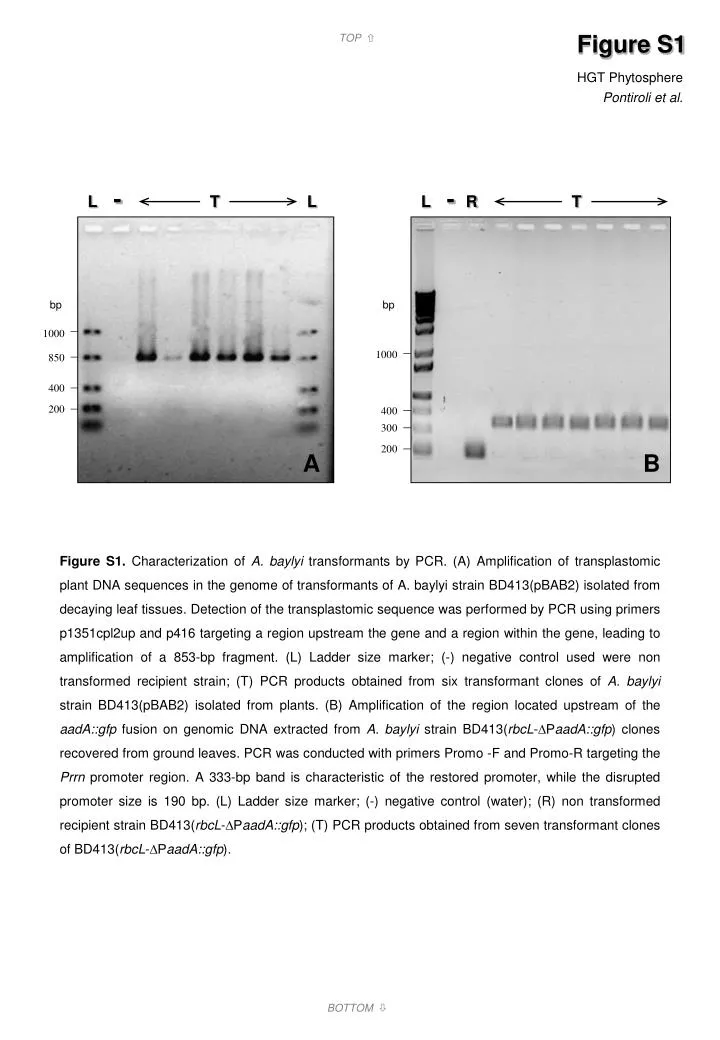
- L R T 1000 850 400 200 1000 400 300 200 Figure S1 - L T L bp bp A B Figure S1. Characterization of A. baylyi transformants by PCR. (A) Amplification of transplastomic plant DNA sequences in the genome of transformants of A. baylyi strain BD413(pBAB2) isolated from decaying leaf tissues. Detection of the transplastomic sequence was performed by PCR using primers p1351cpl2up and p416 targeting a region upstream the gene and a region within the gene, leading to amplification of a 853-bp fragment. (L) Ladder size marker; (-) negative control used were non transformed recipient strain; (T) PCR products obtained from six transformant clones of A. baylyi strain BD413(pBAB2) isolated from plants. (B) Amplification of the region located upstream of the aadA::gfp fusion on genomic DNA extracted from A. baylyi strain BD413(rbcL-∆PaadA::gfp) clones recovered from ground leaves. PCR was conducted with primers Promo -F and Promo-R targeting the Prrn promoter region. A 333-bp band is characteristic of the restored promoter, while the disrupted promoter size is 190 bp. (L) Ladder size marker; (-) negative control (water); (R) non transformed recipient strain BD413(rbcL-∆PaadA::gfp); (T) PCR products obtained from seven transformant clones of BD413(rbcL-∆PaadA::gfp).
Figure S2 A B C D Figure S2. Visualization of aggregates formed by A. baylyi strain BD413(rbcL-PaadA::gfp), constitutively expressing the GFP, on the surface of tobacco plant debris. (A, C) Bright-field images and (B, D) the corresponding epifluorescence micrographs. (A, B: bars = 100 µm; C,D: bars = 10 µm).
Figure S3 A B C D Figure S3. Visualization of aggregates formed by A. baylyi strain BD413(rbcL-PaadA::gfp), constitutively expressing the GFP, on the margin of tobacco plant debris. (A, C) Bright-field images and (B, D) the corresponding epifluorescence micrographs. (A, B: bars = 100 µm; C, D: bars = 10 µm).