Download
1 / 50
500 likes | 675 Vues
A gentle introduction to R – how to load in data and produce summary statistics. BRC MH Bioinformatics group. Tutorial outline. How to install R on your own computers Its free But its already installed on these computers Loading data from excel Plotting Summary statistics. Files.

E N D
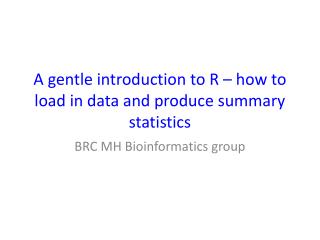
A gentle introduction to R – how to load in data and produce summary statistics BRC MH Bioinformatics group
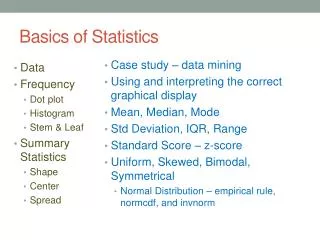
Tutorial outline • How to install R on your own computers • Its free • But its already installed on these computers • Loading data from excel • Plotting • Summary statistics
Files • Data and slides on: • http://core.brc.iop.kcl.ac.uk/brc-bioinformatics-workshop-october-2012
Show file extensions • Uncheck ‘hide extensions for known file types’ • Click ‘Apply’
Installing R – skip as already installed And follow operating system specific installation instructions
?read.table Loading help files • A useful function is read.table() • It allows you to read data from spreadsheets into R • To see it’s help file you can use • You can use ?function_name for any function to see a help file
From excel Open testdata.xls
From excel • You need to save it as a comma separated value file (.csv), go to file>save as>other formats
R working directory • To open a file you will need to point R towards the folder that contains it. • You can do this with setwd(), but we’ll do it using the mouse • Suppose you have the file in My Documents
getwd() list.files() ls() Browsing folders • To check that you are in the right folder type • To see files in this folder you can type • To list the current variables type • Nothing should be loaded yet
Loading data To follow along with this section, make sure your R working directory is that which contains the tutorial data
my.data <- read.csv(‘testdata.csv’) my.data <- read.table(‘testdata.csv’,sep=‘,’,header=TRUE) • Read the contents of file testdata.csv into an R variable my.data with: • read.csv is a wrapper for read.table which lets you specify more details about your file, eg:
read.table() • sep : Column separator • header : Does the first row of the file contain column headers? • skip : Number of rows to skip at the top of the file • ?read.table for other useful parameters
ls() head(my.data) summary(my.data) • Check your new variable is in the R environment: • Take a look at the top couple of lines: • Generate some basic summary stats:
rownames(my.data) colnames(my.data) nrow(my.data) ncol(my.data) dim(my.data) • Check the dimensions of your dataset: • Number of rows and columns • Row and column names
my.data[1,] my.data[,1] my.data[10,3] • Look at the first row: • Look at the first col: • Look at the third column of row 10
my.data[100:110,1] my.subset <- my.data[100:110,1] my.data[c(30,40,50,60),] my.indices <- c(30, 40, 50, 60) my.data[my.indices,] • Look at the first column for rows 100 to 110 • Same as above, but save to a variable • Look at rows 30,40,50 and 60 • Same as above but pre-defining the index vector
my.data[1,’weight’] my.data[1,c(’weight’,’height’)] cols <- c(’weight’,’height’) my.data[1,cols] You can subset on names instead of indices: • Look at the column named 'weight' for row 1: • Look at the columns named 'height' and 'weight' for row 1: • Same as above but pre-define the colnames vector
my.indices <- -1 * c(35, 67, 101) my.new.data <- my.data[my.indices,] my.data[1,-2] my.new.data <- my.data[-1:-100,] Negative indices exclude elements: • Look at all columns except the second for row 1 • Extract all rows except 1-100 • Extract all rows except 35, 67,101
How tall is the person in the 7th row? • What gender is the person in the 300th row? • For the people in rows 20-30, who is the heaviest? • For the people in rows 110, 350, 219, 74, who is the tallest? • Save all rows except 500-600 in a variable my.new.data • How many males and females are in this new dataset?
Data isn't comma-separated? • Specify the separator in read.table • tab-delimited text is another common format, for which you can use sep=”\t” Load "testdata.txt", a tab-delimited version of the data
Data has extra header information at the top? • Either delete this data in Excel before exporting to csv • Or, use the skip=N argument to read.table Have a look at "testdata_1.csv" in Excel and then load it into R using read.table
Factors are inconsistently named • R will just read in the data you give it. • If you aren't consistent naming the levels of your factors it will see them as different levels • R is case sensitive. 'MyLevel' != 'mylevel' Load the data from testdata_2.csv and have a look at the gender variable. Try and fix the problems in Excel and reload.
Measurements and units in a single column • If you store values like 10kg, R will not interpret this as a numeric column Try loading file 'testdata_3.csv' - what has happened to the weights and heights information? Try loading again so that the two are loaded as character vectors. Have a look at the sub() function and see if you can fix the problem
Excel has just screwed up your data • Older versions of Excel have a limit of 65536 rows. If you open a larger dataset in Excel it will be truncated. If you then save this dataset you will be saving the truncated version. Avoid opening large datasets in Excel, use R • Excel tries to be helpful by formatting elements for you. Try the following and then open in Excel, save as csv and reload into R. What has happened? my.genes<-c('MASH1','SOX2','OCT4') write.csv(my.genes, file='mygenes.csv')
Drawing histograms Optional exercises – 1) Try drawing a histogram of height 2) Try and label the x axis [hint: read the help file]
qqnorm(my.data$weight);qqline(my.data$weight) Drawing normal QQ plots
plot(height~weight,data=my.data,col=as.numeric(gender)) plot(height~weight,data=my.data) Drawing scatterplots Optional exercises: try these, do you understand this plot?
boxplot(height~gender,data=my.data) Drawing boxplots
jpeg(“boxplot.jpg”) boxplot(height~gender,data=my.data) dev.off() pdf(“boxplot.pdf”) boxplot(height~gender,data=my.data) dev.off() Saving plots JPEGs PDFs
Functions Covered • read.table() • head() • dim() • write.table() • mean() • sd() • cor() • cor.test() • t.test() • shapiro.test() • wilcox.test() • kruskal.test() • lm() • anova() • coefficients() • fitted() • residuals() • NB: to find help type • ?function • Eg: ?cor http://www.statmethods.net/index.html
It is always important to check model assumptions before making statistical inferences