Download
1 / 35
520 likes | 1.16k Vues
04/20/2006. Design Storms. Reading: Applied Hydrology Sec 14.1 – 14.4. Design Storm. Design storm – precipitation pattern defined for use in the design of hydrologic system Serves as an input to the hydrologic system Can by defined by: Hyetograph (time distribution of rainfall)

E N D
04/20/2006 Design Storms Reading: Applied Hydrology Sec 14.1 – 14.4
Design Storm • Design storm – precipitation pattern defined for use in the design of hydrologic system • Serves as an input to the hydrologic system • Can by defined by: • Hyetograph (time distribution of rainfall) • Isohyetal map (spatial distribution of rainfall)
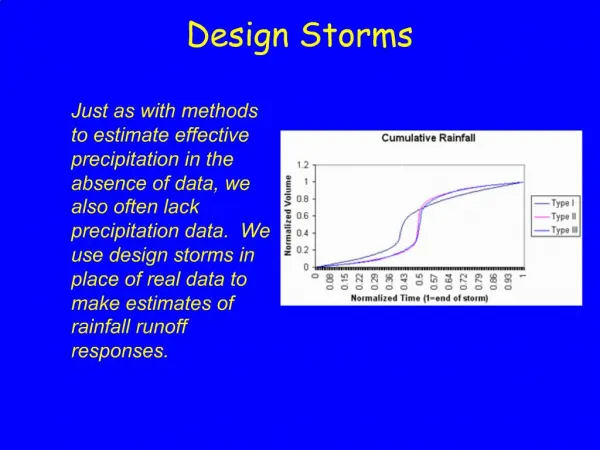
Extreme value (EV) distributions • Extreme values – maximum or minimum values of sets of data • Annual maximum discharge, annual minimum discharge • When the number of selected extreme values is large, the distribution converges to one of the three forms of EV distributions called Type I, II and III
EV type I distribution • If M1, M2…, Mn be a set of daily rainfall or streamflow, and let X = max(Mi) be the maximum for the year. If Mi are independent and identically distributed, then for large n, X has an extreme value type I or Gumbel distribution. Distribution of annual maximum streamflow follows an EV1 distribution
EV type III distribution • If Wi are the minimum streamflows in different days of the year, let X = min(Wi) be the smallest. X can be described by the EV type III or Weibull distribution. Distribution of low flows (eg. 7-day min flow) follows EV3 distribution.
Design point precipitation • Historic data of precipitation is available • Precipitation data are converted to different durations (Table 3.4.1) • Annual maximum precipitation for a given duration is selected for each year • Frequency analysis is performed to derive design precipitation depths for different return periods • The depths are converted to intensities by dividing by precipitation durations
IDF curves by frequency analysis • Get annual maximum series of precipitation depth for a given duration • Use EV1/Gumbel distribution to find precipitation depth for different return periods • Repeat 1 and 2 process for different durations • Plot depth versus duration for different frequencies
Example 14.2.1 • Determine i and P for a 20-min duration storm with 5-yr return period in Chicago From the IDF curve for Chicago, i = 3.5 in/hr for Td = 20 min and T = 5yr P = i x Td = 3.5 x 20/60 = 1.17 in
TP 40 • Hershfield (1961) developed isohyetal maps of design rainfall and published in TP 40. • TP 40 – U. S. Weather Bureau technical paper no. 40. Also called precipitation frequency atlas maps or precipitation atlas of the United States. • 30mins to 24hr maps for T = 1 to 100 • Web resources for TP 40 and rainfall frequency maps • http://www.tucson.ars.ag.gov/agwa/rainfall_frequency.html • http://www.erh.noaa.gov/er/hq/Tp40s.htm • http://hdsc.nws.noaa.gov/hdsc/pfds/
24-hour Design Rainfall Totals http://onlinemanuals.txdot.gov/txdotmanuals/hyd/ebdlkup.xls
Rainfall Frequency Analysis from TP-40 tc = time of concentration in minutes (not less than 10 minutes) I = rainfall intensity (inches/hour) http://onlinemanuals.txdot.gov/txdotmanuals/hyd/the_rational_method.htm#i999837
Rainfall Frequency Analysis in Texas For tc = 24 hours = 24*60 = 1440 min, I = 7.53 inches/hour
2yr-60min precipitation map This map is from HYDRO 35 (another publication from NWS) which supersedes TP 40
IDF curves for Austin Source: City of Austin, Watershed Management Division
Design Precipitation Hyetographs • Most often hydrologists are interested in precipitation hyetographs and not just the peak estimates. • Techniques for developing design precipitation hyetographs • SCS method • Triangular hyetograph method • Using IDF relationships (Alternating block method)
SCS Method • SCS (1973) adopted method similar to DDF to develop dimensionless rainfall temporal patterns called type curves for four different regions in the US. • SCS type curves are in the form of percentage mass (cumulative) curves based on 24-hr rainfall of the desired frequency. • If a single precipitation depth of desired frequency is known, the SCS type curve is rescaled (multiplied by the known number) to get the time distribution. • For durations less than 24 hr, the steepest part of the type curve for required duraction is used
SCS Method Steps • Given Td and frequency/T, find the design hyetograph • Compute P/i (from DDF/IDF curves or equations) • Pick a SCS type curve based on the location • If Td = 24 hour, multiply (rescale) the type curve with P to get the design mass curve • If Td is less than 24 hr, pick the steepest part of the type curve for rescaling • Get the incremental precipitation from the rescaled mass curve to develop the design hyetograph
Example – SCS Method • Find - rainfall hyetograph for a 25-year, 24-hour duration SCS Type-III storm in Harris County using a one-hour time increment • a = 81, b = 7.7, c = 0.724 (from Tx-DOT hydraulic manual) • Find • Cumulative fraction - interpolate SCS table • Cumulative rainfall = product of cumulative fraction * total 24-hour rainfall (10.01 in) • Incremental rainfall = difference between current and preceding cumulative rainfall TxDOT hydraulic manual is available at: http://manuals.dot.state.tx.us/docs/colbridg/forms/hyd.pdf
SCS – Example (Cont.) If a hyetograph for less than 24 needs to be prepared, pick time intervals that include the steepest part of the type curve (to capture peak rainfall). For 3-hr pick 11 to 13, 6-hr pick 9 to 14 and so on.
ta tb Rainfall intensity, i h Td Time Triangular Hyetograph Method Td: hyetograph base length = precipitation duration ta:time before the peak r: storm advancement coefficient = ta/Td tb: recession time = Td – ta = (1-r)Td • Given Td and frequency/T, find the design hyetograph • Compute P/i (from DDF/IDF curves or equations) • Use above equations to get ta, tb, Td and h (r is available for various locations)
Triangular hyetograph - example • Find - rainfall hyetograph for a 25-year, 6-hour duration in Harris County. Use storm advancement coefficient of 0.5. • a = 81, b = 7.7, c = 0.724 (from Tx-DOT hydraulic manual) 3 hr 3 hr Rainfall intensity, in/hr 2.24 6 hr Time
Alternating block method • Given Td and T/frequency, develop a hyetograph in Dt increments • Using T, find i for Dt, 2Dt, 3Dt,…nDt using the IDF curve for the specified location • Using i compute P for Dt, 2Dt, 3Dt,…nDt. This gives cumulative P. • Compute incremental precipitation from cumulative P. • Pick the highest incremental precipitation (maximum block) and place it in the middle of the hyetograph. Pick the second highest block and place it to the right of the maximum block, pick the third highest block and place it to the left of the maximum block, pick the fourth highest block and place it to the right of the maximum block (after second block), and so on until the last block.
Example: Alternating Block Method Find: Design precipitation hyetograph for a 2-hour storm (in 10 minute increments) in Denver with a 10-year return period 10-minute
Design aerial precipitation • Point precipitation estimates are extended to develop an average precipitation depth over an area • Depth-area-duration analysis • Prepare isohyetal maps from point precipitation for different durations • Determine area contained within each isohyet • Plot average precipitation depth vs. area for each duration
Depth-area curve (World Meteorological Organization, 1983)
Study by Will Asquith, USGS http://pubs.usgs.gov/wri/wri99-4267/pdf/wri99-4267.pdf
Depth (intensity)-duration-frequency • DDF/IDF – graph of depth (intensity) versus duration for different frequencies • TP 40 or HYDRO 35 gives spatial distribution of rainfall depths for a given duration and frequency • DDF/IDF curve gives depths for different durations and frequencies at a particular location • TP 40 or HYDRO 35 can be used to develop DDF/IDF curves • Depth (P) = intensity (i) x duration (Td)
Probable Maximum Precipitation • Probable maximum precipitation • Greatest depth of precipitation for a given duration that is physically possible and reasonably characteristic over a particular geographic region at a certain time of year • Not completely reliable; probability of occurrence is unknown • Variety of methods to estimate PMP • Application of storm models • Maximization of actual storms • Generalized PMP charts
Probable Maximum Storm • Probable maximum storm • Temporal distribution of rainfall • Given as maximum accumulated depths for a specified duration • Information on spatial and temporal distribution of PMP is required to develop probable maximum storm hyetograph
Probable Maximum Flood • PMF – greatest flood to be expected assuming complete coincidence of all factors that would produce the heaviest rainfall (PMP) and maximum runoff • Flood of unknown frequency • Most structures are not designed for PMF, but for greatest floods that may be reasonably expected for local conditions (meteorology, topography, and hydrology) • The design flood is commonly called standard project flood derived from standard project storm