Download
1 / 18
200 likes | 457 Vues
Usability of Car Dashboard Displays for Elder Drivers. SeungJun Kim, Joonhwan Lee, Anind K. Dey , and Jodi Forlizzi. Elderly drivers. Quality of life ↔ Independent mobility Suen , S. L. and Sen , L. (2004) Mobility options for seniors . Our premise.

E N D
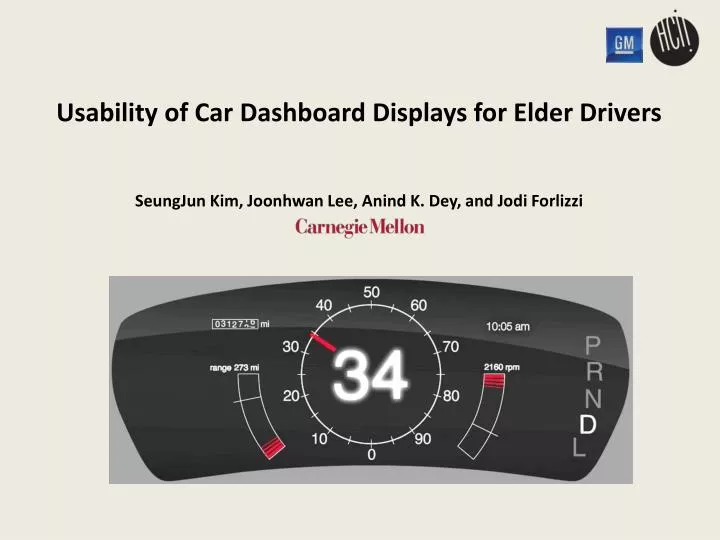
Usability of Car Dashboard Displays for Elder Drivers SeungJun Kim, Joonhwan Lee, Anind K. Dey, and Jodi Forlizzi
Elderly drivers • Quality of life ↔ Independent mobility • Suen, S. L. and Sen, L. (2004) Mobility options for seniors
Our premise • Age-related declines - vision, hearing, and motor skills • Negative impacts on driving • Ball, K., et al (1998), Driving avoidance and functional impairment in older drivers • UMTRI (1998), The assessment of older drivers’ capabilities: A review of the literature • Car dashboard display designs for seniors • Supporting better attention switching (e.g., minimizing eye-off-the-road issues) • Enhancing perceptual speed and visual search abilities
Research Questions What are the differences in the ways elder and non-elders manage attention while driving? Can particular aspects of the instrument panel display designs help elders better manage attention and perform better while driving?
Six dashboard designs • Five information panels - simulated Display Type I Display Type II Low clutter + High contrast of size High clutter + Low contrast of size No color Color elements Color elements and fills
Embedded design features • Predictions • Clutter type will impact a design’s effect on driving performance more than design features. • Low clutter designs will require less fixation time and, therefore, less response time in answering a prompt for information. This difference will be greater for elderly than younger drivers. • Color will cause a greater attraction of attention than contrast in size for elderly drivers. Designing using color will have a faster interpretation time than designs using contrast in size. Clutter Hierarchy or Contrast Color & Background Fill No fill Fill No color Low High Small Large 38
Test-bed • Dual-task driving game • Primary Task – coin-collecting driving • Secondary Task – reporting dashboard information after a voice command ‘time?’ ‘speed?’ Wheel joystick Eye tracker (SmartEyePro)
Evaluation • 32 participants - counter-balanced within-subject (six conditions) • 18 elderly participants (age range/mean: 65-89/74) • 14 younger participants (18-63/34) • Measures • Task performances • Primary Task - Lane deviation / Missed coins • Secondary Task - Response time (RT) / Answer duration (AD) • Issues of divided attention (eye-off-the-road) • Gaze dwell-on time (how long) • Gaze drop-by frequency (how often)
Elder vs. Younger 9.91 • Younger group – less errors in primary task performances 7.77 9.70 Elder group Lane Deviation (pixel) Younger group Primary Task 4.36 Missed Coins (count) 4.32 Time on Secondary Task (sec) (= Response Time + Answer Duration) 3.94 0.0 2.0 4.0 6.0 8.0 10.0
Primary Task • Larger lane deviation with color-added deigns for elders (1.15 times ) 10.40 9.00 38 Color-added designs No-color designs Elders’ Lane Deviation (pixel)
Secondary Task • No difference between age groups • Design features impact on RT and AD • Type I – Low clutter + High contrast of size • Generally faster RT - across the panels overall • Significantly faster RT and shorter AD - for central panels • Significantly longer AD - for peripheral panels Time on Secondary Task (sec) Elder group Response Time (2.08s) Answer Duration (2.24s) Younger group Response Time (1.98s) Answer Duration (1.95s) 0.00 2.00 4.00 6.00 Type I central peripheral peripheral Type II
Secondary Task • Design features + panel zones impact on elders’ answer duration Elder group Younger group 1.0 Type II Type II Type I Type I
Gaze Analysis • Design features impact on gaze movement • Type I – Low clutter + High contrast of size • Elderly group – significantly less gaze dwell-on time on dashboard displays 60.0 5.96 seconds less, p<0.039 * Type II 40.0 Type I Gaze dwell-on time (sec) 20.0 0.0
Gaze Analysis • Design features + panel zones impact on gaze movement • Type I – Low clutter + High contrast of size • Less gaze dwell-on time and less gaze drop-by frequency • Central panels: 2.24 seconds shorter and 4.05 fewer times • Peripheral panels: 0.81 seconds shorter and 1.94 fewer times Speedometer Central Speedometer / Clock / Odometer Clock / Fuel gauge / Odometer / Tachometer Peripheral Fuel gauge / Tachometer
Summary - design feature analysis • Clutter + Contrast of size • Impact on both gaze movement and task performance • Color • Elderly group - No impact on gaze movement • Reduced lane deviation with no-color dashboards • Peripheral panels - improved response time with background fills • Younger group - No impact on task performance • Peripheral panels - shorter gaze dwell-on time with colored dashboards 38 > + + careful
Summary - design implications Low clutter. Simple, low clutter designs should be used for the whole dashboard. Ample “white space” is needed, particularly between individual features of the dashboard. Contrast of size. Reserve maximum contrast of size for the center panel, in particular the speedometer, since this feature is what elderly drivers reference most often when driving. Color. Use color for elements plus background fills, rather than for elements only.
Future works • More realistic dual-task driving simulation • Reconfigurable car dashboard displays • Contextually switching designs • Traffic events (e.g., pedestrians, other cars) • Driving environment (e.g., highways) • Driver’s cognitive load
Thank you. This research was generously funded by General Motors. Especially thanks to our participants Contact: SeungJun Kim (sjunikim@cs.cmu.edu) Jodi Forlizzi (forlizzi@cs.cmu.edu)