Download

1 / 20
240 likes | 708 Vues
Chapter 7 Monte Carlo Simulation. - ------- What is the last thing you do before you climb on a ladder? You shake it. “ That is Monte Carlo Simulation ” Standford University Researcher Sam Savage. 1,Monte Carlo Simulation.

E N D
Chapter 7 Monte Carlo Simulation -------- What is the last thing you do before you climb on a ladder? You shake it. “That is Monte Carlo Simulation” Standford University Researcher Sam Savage
1,Monte Carlo Simulation • Simulation is a procedure in which random numbers are generated according to probabilities assumed to be associated with a source of uncertainty, such as, stock prices, interest rates.. • Outcomes associated with these random drawings are then analyzed to determine the likely related results. • Oftentimes this technique is called Monte Carlo simulation, being named for the city of Monte Carlo, which is noted for its casinos. (卡西诺赌场.) 2
2,Uniform distribution • f(x)=1 ,x∈[0,1], and f(x)=0 ,otherwise • x=random(), or, x=random() • ?How to generate an uniform distribution between [0,2] 3
2,Uniform distribution • Example: Cal the mean of uniform distribution • (1), • (2)dime tem(1000) a=0 for I=1 to 1000 tem(i)=random() a=a+tem(i) endfor ex=a/1000 (3)Excel: See 007simulation-uniform.xls 4
2,Uniform distribution • Strengths of Monte Carlo : can be used to price complex securities for which no analytical method is available • Weakness: provide only statistical estimates, not exact results. Analytic methods, where available, provides more insight into cause-and-effect relationships. 5
3,Bernoulli Distribution X~B(1,0,p) • How to generate a Bernoulli Distribution ,X=1 (p) X=0(1-p)? • Example : p=0.3 • Z=random() • If z<=0.3 • X=1 • Else X=0 • Endif • * X will follow Bernoulli Distribution, X~B(1,0,p) 6
3,Bernoulli Distribution X~B(1,0,p) • Stimulate stock price by Bernoulli • Suppose annual mu=10%,sigma=8% S0=10. • What would be the monthly price ? • U=exp{sigma*√1/12}, P=(1+mu√1/12/sigma)/2 • S(i-th month)=s(I-1 month)*u^Y*d^(1-Y) 7
4,Normal Distribution by Monte Carlo • (1)If Xi (I=1,2,…,12) is uniform distributed between 0 and 1. then ∑Xi–6~approximately follow N(0,1). • Proof: • Since is Xi i.i.d. • by Central Limitation Theorem • That is ∑Xi–6~approximately follow N(0,1). 8
4,Normal Distribution by Monte Carlo • 2)Example : Use Monte Carlo to Cal mean and variance of standard normal R.V.(Foxpro,D:\金数教学\2003\讲义\monte1.prg) • dime tem (10000) • for i= 1 to 10000 tem(i)=rand()+rand()+rand()+rand()+rand()+rand()+rand()+rand()+rand()+rand()+rand()+rand()-6 • endfor • mean=0 • for i=1 to 10000 • mean=mean+tem(i) • endfor • mean=mean/10000 • ?mean 9
4,Normal Distribution by Monte Carlo • when I is 1000, mean=0.0398, var=0.98 • when tem=12*ran()-6, var=11 • Excel : See 007simulation-uniform.xls • (What’s analytical solution , and numerical solution by Monte Carlo) 10
5, Simulate normal related R.V. • K-square (1): square of Standard Normal • K-square (5): sum the squares of five Standard Normal • T-(1): X/sqrt{K-square (1)},R.V. independent • T-(5): X/sqrt{K-square (5)/5}, R.V. independent • F(1,1): K-square (1)/ K-square (1), R.V. independent • F(1,5): K-square (1)/ K-square (5), R.V. independent • See 007simulation.xls 11
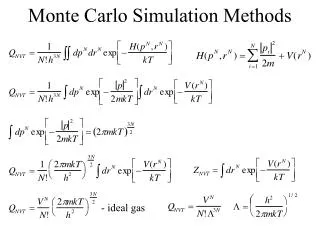
6,Simulate GBM (Stock Price ) by Monte Carlo • (1)Basic Principle: • If stock moves t trading days, and we divide t into n intervals(i=1,…t/n),the length of the interval is Δ, the last formula is equal to • S(Δi) is stock’s price at the end of the i-th interval. • (without-log) 12
6,Simulate GBM (Stock Price ) by Monte Carlo • Function provided by Matlab • D:\金融数学讲义\2003\Brown.m function blssample(S0,T,n,mu,sigma) %This function produces a sample path of a diffusion process %given by the SDE, dS=mu*S*dt+sigma*S*dX, %in the interval [0,T] discretized with n division points %variables T=length of the interval, n = number of division points, %mu=drift, sigma=volatility 13
6,Simulate GBM (Stock Price ) by Monte Carlo • t=0:T/n:T-(1/n); dt=T/n; • phi=random('Normal',0,1,n,1); • X=zeros(1,n); S=zeros(1,n); • M=zeros(1,n); M(1)=S0; • S(1)=S0; for i = 1:1:n-1 • dX(i)=sigma*phi(i)*sqrt(dt); • S(i+1)= S(i)+mu*S(i)*dt+sigma*S(i)*dX(i); • M(i+1)=M(i)+mu*M(i)*dt; • End plot(t,S); • Hold plot(t,M); • hold; end • Initial price is 5, annual drift and volatility are 3% and 8%, give an possible path of the stock in future 3 years . • 调用函数blssample(5,3,100,0.03,0.08)得到上图007 brownian simaulation。 14
6,Simulate GBM (Stock Price ) by Monte Carlo • (2)How to estimate the drift and volatility coefficient • See 007 estim drif volat 15
7,Cal expected stock price . • Suppose s0=RMB 5, mu=0.03, sigma=0.08. 1, suppose price is GBM, calculate the expected price 3 years later. • (1)Analytical Method 16
(2)Numerical Method • Step one: divide 3 years into 100 interval, and simulate the price 3 years later. Step two : Repeat step one 1000 times, and calculate the average price(D:\金数教学\2003\讲义\montebs.prg计算股票的期望值 • dime E(1001),s(100) • s(1)=5 • E(1)=0 • mu=0.03 • sigma=0.08 • t=3 • n=100 • dt=t/n • for j=1 to 1000 • for i= 1 to 99 • normz=rand()+rand()+rand()+rand()+rand()+rand()+rand()+rand()+rand()+rand()+rand()+rand()-6 • s(i+1)=s(i)+mu*s(i)*dt+sigma*s(i)*sqrt(dt)*normz • endfor • e(j+1)=s(100)+e(j) • endfor • ?e(j)/1000 =5。48 17
8,Simulate Poison Distribution , Jump GBM and mean reversion • 007poison.xls • 007 jump [including mean reversion ,BM] 18
Exercise: • Simulate Normal (5,1)and Poison(lamda=5). • Draw their histogram 19
Exercise: • Use Excel to Solve 3.1(b). Two condition: • Divide 10 years into 100 interval, and cal P[S(10)>100] • Which condition is more closer to the analytical method? • {Hint: By Monte Carlo, repeat your simulation 50 times , then count the times when S(10)>100}. • ( by email) 20