Download
1 / 34
340 likes | 342 Vues
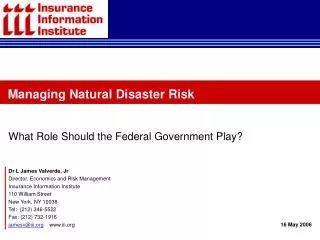
Hurricane Risk in NY City & Long Island. Towards a More Realistic Appraisal of Extreme Weather Risk in the Northeast United States. Dr L James Valverde, Jr Director, Economics and Risk Management Insurance Information Institute 110 William Street New York, NY 10038 Tel: (212) 346-5522

E N D
Hurricane Risk in NY City & Long Island Towards a More Realistic Appraisal of Extreme Weather Risk in the Northeast United States Dr L James Valverde, Jr Director, Economics and Risk Management Insurance Information Institute 110 William Street New York, NY 10038 Tel: (212) 346-5522 Fax: (212) 732-1916 jamesv@iii.org www.iii.org 5 May 2006
Recent Assertions Concerning Hurricane Risk Exposure for New York City and Long Island Hurricane Risk in the Northeast United States: Current Scientific Understanding A look at NOAA’s hurricane return period estimates for NY City and Long Island Relevant background on the NOAA hurricane risk data What the NOAA hurricane risk data says – and doesn’t say Are hurricane return period estimates reliable predictors of future hurricane activity? Towards a More Robust and Realistic Appraisal of Extreme Weather Risk for New York City and Long Island Key components of a complete risk characterization Relevant history of extreme weather events in New York City Other potential hazards: Northeasters Global Warming and Extreme Weather Potential implications for the Northeast United States Summary and Conclusions Presentation Outline
In recent months, it has been asserted that concerns about hurricane risk exposure in New York City and Long Island are “bogus” In support of these claim, several NOAA statistics have been cited: “Recent statistics from the National Oceanic and Atmos-pheric Administration (NOAA) show that the odds of a category 4 or higher hurricane hitting New York City is once every five hundred years and on Montauk Long Island once every 130 years” [emphasis added] On the basis of these values, some have concluded that “[t]he hurricane data hardly demonstrates a risk [to New York City and Long Island]” Recent Assertions Concerning Hurricane Risk Exposure for New York City and Long Island
The “1-in-500 year” and “1-in-130 year” values for New York City and Long Island that have been cited in recent press releases are actually expected return periods – they are not probabilistic projections of future hurricane activity for the region In simple terms, hurricane return period values are interpreted as the expected long-run frequency with which hurricanes of a specified intensity (e.g., Category 3, etc.) may be expected to occur within 75 NMi of New York City or Long Island Estimates of hurricane return periods are derived from historical data: For example, a return period of 20 years for a Category 3 hurricane means that, on average, during the previous 100 years, a category 3 hurricane passed within 75 miles of that location approximately 5 times Hurricane Risk in the Northeast U.S.: A Look at NOAA’s Return Period Estimates for NY City and Long Island Source: NOAA
The NY City and Long Island hurricane risk data cited in recent press releases is produced by NOAA’s National Hurricane Center Risk Analysis Program, HURISK HURISK estimates the expected return period for hurricanes of varying intensities Key elements of HURISK’s estimation procedure: A population of tropical cyclones falling within a 75mi circle of a given location (e.g., New York City) is obtained from NOAA’s best-track file For that particular set of storms, the maximum wind within the 75mi circle is found A count is then conducted to determine how many systems had winds of 30-34 kts, 35-39 kts, etc. A probability distribution is then fit to this distribution of historical values (e.g., Weibel distribution) From the fitted distribution, the probability p of exceeding a specific wind speed is computed The return period value in years is simply the reciprocal, 1/p This value gives an indication of the number of systems that may occur in the future Relevant Background on the NOAA Hurricane Risk Data Source: NOAA
HURISK Results for Hurricanes Passing Within 75 NMi of New York City: 1870 - 2004 Source: Graph courtesy of Colin McAdie, NOAA Tropical Prediction Center
NOAA Hurricane Risk Data in a More Realistic Context Source: Based on data provided by the NOAA Tropical Prediction Center
The expected return period estimates for Category 2 and Category 3 hurricanes passing within close proximity to New York City are commensurate with return period estimates for the Gulf Coast and the Southeast Estimates of expected return periods for Category 4 and Category 5 hurricanes affecting New York City are compromised by limitations / deficiencies in the available historical record of hurricane activity for the region What the NOAA Hurricane Risk Data Says – and Doesn’t Say
Long-Run Return Period Estimates for Tropical Cyclone Winds: New York City, 1870 - 2004 Source: Graph courtesy of Colin McAdie, NOAA Tropical Prediction Center
Tropical cyclone winds consistent with Category 4 and Category 5 hurricanes are not realized in NOAA’s long-run (10,000 years) simulations for NY City This result is purely an artifact of the available historical record This result can easily be misinterpreted to mean that such events are impossible for the region Characterizations like this of long-run likelihoods are highly-dependent on geographic location Miami is much more likely to be affected by Category 4 & 5 hurricanes – a fact that is well reflected in the historical record As a consequence, the long-run return period data for that region of the country is more reliable than that for the Northeast U.S. Uncertainty in return period estimates is greatest for severe hurricanes (Category 4 & 5) affecting NY City and Long Island, as these extreme weather events are seen to occur much less frequently in the historical record Implications of the NOAA Long-Run Data
Hurricane return period estimates are based on historical data (e.g., historical tropical storm activity from 1851-2004) The data may be incomplete, missing, or unreliable The data may not be representative, or perhaps not large enough to yield statistically significant estimates and inferences Detailed historical records for hurricane activity in the Atlantic Basin is ~100 years Complicates efforts to arrive at reliable return period estimates of “storm-of-the-century” effects Estimates of hurricane return periods presume that the future will look like the past “If all things were equal…” Mean return period estimates are not truly predictive, but rather, conditionallyindicative of what the future might bring, given what has happened historically in terms of extreme hurricane phenomena Most useful in preparedness and response contexts: Structural design Building codes Land-use planning Can aid in the development of flexible and robust catastrophe management systems Are Hurricane Return Period Estimates Reliable Predictors of Future Hurricane Activity?
Focusing solely on the potential frequency of occurrence and severity of future hurricane activity for the region is misleading It is important, also, to characterize and evaluate two other components that – together with frequency and severity of occurrence – comprise extreme weather risk: The intrinsic vulnerability of a specific region or location (e.g., New York City and Long Island) to hurricanes and other extreme weather events Given these vulnerabilities, the potential losses – both economic and insured – that are likely to result from an extreme weather event Towards a More Robust and Realistic Appraisal of Extreme Weather Risk for New York City and Long Island
Hurricane Risk in Context Hurricane Risk in Context
Number of Major (Category 3, 4, 5) Hurricanes Striking the US by Decade 1930s – mid-1960s: Period of Intense Tropical Cyclone Activity Mid-1990s – 2030s? New Period of Intense Tropical Cyclone Activity 10 Tropical cyclone activity in the mid-1990s entered the active phase of the “multi-decadal signal” that could last into the 2030s Already as many major storms in 2000-2005 as in all of the 1990s *Figure for 2000s is extrapolated based on data for 2000-2005 (6 major storms: Charley, Ivan, Jeanne (2004) & Katrina, Rita, Wilma (2005)). Source: Tillinghast from National Hurricane Center: http://www.nhc.noaa.gov/pastint.shtm.
Average Annual Tropical Cyclone Insured Losses* (Top 10 States, $ Millions) Distribution of Annual Losses *Normalized losses adjusted for inflation, housing density, wealth and wind insurance coverage, based on historical data for 100-year period 1900-1999. Source: Tillinghast-Towers Perrin
Inflation-Adjusted U.S. Insured Catastrophe Losses By Cause of Loss, 1985-2004¹ Insured disaster losses totaled $221.3 billion from 1984-2004 (in 2004 dollars). After 2005 season, tropical cyclones will account for 45%+ of the total. 1 Catastrophes are all events causing direct insured losses to property of $25 million or more in 2004 dollars. Catastrophe threshold changed from $5 million to $25 million beginning in 1997. Adjusted for inflation by the III. 2 Excludes snow. 3 Includes hurricanes and tropical storms. 4 Includes other geologic events such as volcanic eruptions and other earth movement. 5 Does not include flood damage covered by the federally administered National Flood Insurance Program. 6 Includes wildland fires. Source: Insurance Information Institute estimates based on ISO data.
Insured Loss & Claim Count for Major Storms of 2005* Hurricanes Katrina, Rita, Wilma & Dennis produced a record 3.2 million claims *Property and business interruption losses only. Excludes offshore energy & marine losses. Source: ISO/PCS as of February 8, 2006; Insurance Information Institute.
Top 10 Most Costly Hurricanes in US History (Insured Losses, $2005) Seven of the 10 most expensive hurricanes in US history occurred in the 14 months from Aug. 2004 – Oct. 2005: Katrina, Rita, Wilma, Charley, Ivan, Frances & Jeanne Sources: ISO/PCS and Insurance Information Institute
Top 11 Insured Property Losses Worldwide, 1970-2005 ($2005)* Five of the 11 most expensive disasters is world history affected the US within the past 4 years. *All figures are for total losses across all locations, not just US. Katrina losses are a preliminary III estimate. Sources: ISO/PCS; Swiss Re, “Natural Catastrophes and Man-Made Disasters in 2003,” Sigma, no.1, 2004
Hurricane Risk in Context Extreme Weather in the Northeast United States: A Look at New York City and Long Island
Number of Hurricanes Directly and Indirectly Affecting the Northeast United States Since 1900 Source: New Hampshire Office of Emergency Management
Extreme weather in New York City and surrounding regions is not without significant historical precedent: Hurricane of 1821. Produced sea-level rise of 13ft in one hour in what is now Battery Park City “West Indian Monster” of 1893. Triggered a 30ft storm surge that bore a destructive path through South Brooklyn and Queens “Long Island Express” of 1938. Severe tidal surge hit Bayport, LI, causing 690 deaths and much damage to property and infrastructure Hurricane Agnes, 1972. Caused record inland flooding across the Northeast. Prior to Hurricane Andrew in 92’, the United States’ most costly natural disaster Tropical Storm Floyd, 1999. New York state and upstate NJ received 10-15 inches of rain during a 24-hour period. Caused massive flash flooding in New York City. Relevant History of Extreme Weather Events in New York City Source: climate.org
Long Island Express of 1938 “Great New England Hurricane” of 1938 aka “Long Island Express” caused severe damage through much of the Northeast, including Long Island Source: WeatherUnderground.com
700 deaths; 708 injured 4,500 homes, cottages, and farms destroyed; 15,000 damaged 26,000 destroyed automobiles 20,000 miles of electrical power and telephone lines downed 1,700 livestock and up to 750,000 chickens killed $2,610,000 worth of fishing boats, equipment, docks, and shore plants damaged or destroyed Half the entire apple crop destroyed at a cost of $2 million Damage Caused by the “Long Island Express” Hurricane of 1938 Source SUNY Suffolk: http://www2.sunysuffolk.edu/mandias/38hurricane/damage_caused.html
Hurricane Risk in Context Catastrophe Loss Management
In addition to hurricanes and tropical storms, northeasters also hold the potential to cause significant damage to New York City and its surrounding regions: The damage they cause can be more widespread than for hurricanes They can inflict greater damage than hurricanes since they often maintain their strength over several tidal cycles at a particular location Relevant historical events include: Blizzard of 1888. 40 inches of snow fell in New York City; ~400 people died. Northeaster of December 1992. Prompted the closing of all transpor-tation infrastructure; caused significant beach and dune erosion “Storm of the Century”, March 1993. Killed 270 people and damaged more than 12,000 homes on Fire Island; economic costs exceeded $3B Hurricanes and Tropical Storms Are Not the Only Potential Hazards: The Case of Northeasters Source: climate.org
Probability of Major Hurricane Landfall (CAT 3, 4, 5) in 2006 *Average over past century. Source: Dr. William Gray, Colorado State University, December 6, 2005.
Value of Insured Commercial Coastal Exposure (2004, $ Billions) New York Insured Commercial Coastal Exposure Source: AIR
Value of Insured Residential Coastal Exposure (2004, $ Billions) New York Insured Residential Coastal Exposure Source: AIR
Total Value of Insured Coastal Exposure (2004, $ Billions) Source: AIR Worldwide
Many credible experts believe that hurricane activity in the Atlantic Ocean may be on the rise There is growing concern that a frequency shift has occurred in the past decade for Atlantic tropical system Long-term effects of the multi-decadal oscillation Periodic effects of El Nino and La Nina The Atlantic and Caribbean Oceans are currently in a heightened period of hurricane activity; this activity increase may continue for several more decades The U.S. Global Change Research Program reports that the minimum and maximum temperatures in NY City ave shown a long-term warming trend during the past century Global climate models project that the region’s temperatures could increase by about 1°–4°F by 2030 and by about 5°–10°F by 2100 Most scientists believe that a warmer atmosphere increases the potential for extreme weather events The latest trends and events suggest that, looking forward, hurricanes may be more destructive due to increases in frequency, intensity, duration, and coastal property exposure Global Warming and Extreme Weather: Potential Implications for the Northeast United States
Most attempts to characterize hurricane and extreme weather risk are static, in that they do not attempt to estimate or model hurricane risks over time: Loss estimate models do not account for changes in building inventory Number, locations, types, and vulnerabilities of buildings in a region vary with time Not taking these factors into account compromises the accuracy of loss estimates It also complicates efforts to reliably appraise the potential effectiveness of possible mitigation strategies Hurricane risk stakeholders need to work towards flexible and robust measures of risk and vulnerability: Need to be able to compute changes in expected annual hurricane losses over time Need, also, to understand the key factors that influence and drive those changes The Need for Dynamic Hurricane Risk Estimation Sources: See, e.g., V. K. Jain et al., “Modeling Changes in Hurricane Risk Over Time,” Natural Hazards Review, May 2005.
Major hurricanes – many with considerable destructive power – have historically affected New York City and LI, and will continue to pose a ongoing threat to the region The region is highly vulnerable to many of the potential consequences that are associated with extreme weather events: Sea-level rise Flooding Storm surge Coastal erosion and potential loss of wetlands A realistic appraisal of the risks that extreme weather poses to the region must look at: Frequency and severity of occurrences Intrinsic vulnerability of the region Loss Estrimation 1995 started a period of substantially more tropical storm systems and hurricanes in the Atlantic Basin Global warming may increase the potential for –and the destructive capability of – extreme weather events: Frequency Intensity Duration Coastal Exposure Summary and Conclusions
www.iii.org Dr L James Valverde, Jr Director, Economics and Risk Management Insurance Information Institute 110 William Street New York, NY 10038 Tel: (212) 346-5522 Fax: (212) 732-1916 jamesv@iii.orgwww.iii.org INSURANCE INFORMATION INSTITUTE ON-LINE If you would like a copy of this presentation, please give me your business card with e-mail address