Download
1 / 14
140 likes | 245 Vues
Drought Mapping of the Pedernales Watershed. CE 394K.3 Term Project by Heather Davis. Population Growth: Competition for water among agricultural, industrial, commercial, and residential sectors Water availability in Texas becoming more scarce. Current Drought: Wildfires

E N D
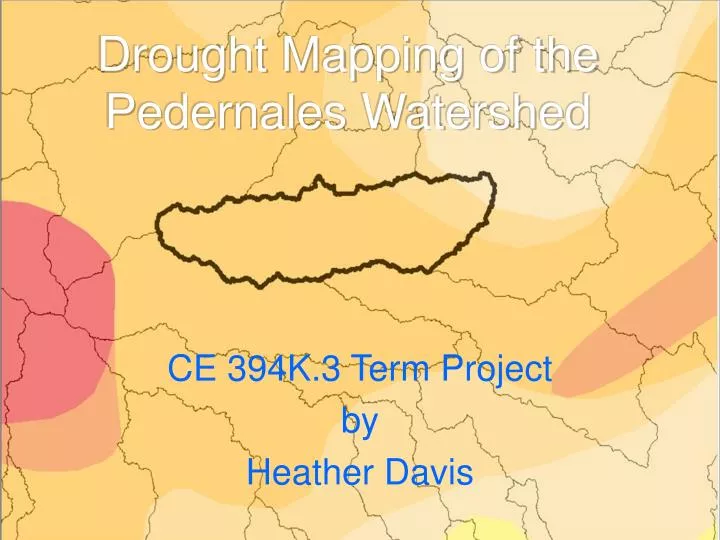
Drought Mapping of the Pedernales Watershed CE 394K.3 Term Project by Heather Davis
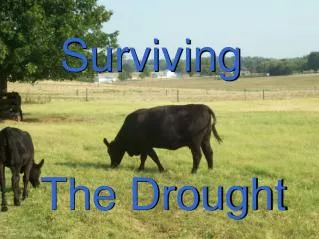
Population Growth: Competition for water among agricultural, industrial, commercial, and residential sectors Water availability in Texas becoming more scarce Current Drought: Wildfires Affected crops/livestock Water restrictions Project Background
Drought Measure Indicators • Palmer Drought Severity Index (PDSI) • Crop Moisture Index (CDI) • Standardized Precipitation Index (SPI) • Percent of Normal • Surface Water Supply Index (SWSI)
Research – How to Proceed? Available Usable Data: • National Oceanic & Atmospheric Administration – National Climatic Data Center (1895-present!) • University of Nebraska-Lincoln – US Drought Monitor Maps (1999-present)
Palmer Drought Severity Index • Standardized to local climate, good for long-term prediction • Not particularly useful in calculating supplies of water locked up in snow or for short-term forecasts • Positive numbers reflect rainfall, or an abundance of available water • Negative numbers reflect drought, or a lack of available water
Palmer Drought Severity Index (PDSI) • 0 – Abnormally Dry • -1 – Moderate Drought • -2 – Severe Drought • -3 – Extreme Drought • -4 – Exceptional Drought
Data Source: http://droughtmonitor.unl.edu/dmshps_archive.htm
Data Source: ftp://ftp.ncdc.noaa.gov/pub/data/cirs/drd964x.pdsi.txt
Data Source: ftp://ftp.ncdc.noaa.gov/pub/data/cirs/drd964x.pdsi.txt
Data Source: ftp://ftp.ncdc.noaa.gov/pub/data/cirs/drd964x.pdsi.txt
Data Source: ftp://ftp.ncdc.noaa.gov/pub/data/cirs/drd964x.pdsi.txt
12 Week Animation • http://droughtmonitor.unl.edu/12_week.gif
Work to Come • Statistical analysis of compiled data to assist in drought prediction • Development of mathematical model to predict oncoming drought