Download
1 / 25
250 likes | 348 Vues
WRAP Regional Haze CMAQ 1996 Model Performance and for Section 309. Gail Tonnesen University of California Riverside. March 27, 2003, Denver, CO. Clean boundary conditions and initial conditions using EPA defaults with some updates to BC based on clean IMPROVE sites PM data. CMAQ Domain.

E N D
WRAP Regional Haze CMAQ 1996 Model Performance and for Section 309 Gail Tonnesen University of California Riverside March 27, 2003, Denver, CO
Clean boundary conditions and initial conditions using EPA defaults with some updates to BC based on clean IMPROVE sites PM data. CMAQ Domain
Domain: 85 columns, 95 rows, 18 layers, 36km grid cells horizontally Lambert-Conformal Projection Emissions: based on NEI with many updates: MOBILE6, EMFAC, Biogenics: BEIS2, Point, Road Dust, Wild Fire (no Ag or Rx), Point for Mexico, no fugitive dust Meteorology: From EPA MM5 1996 simulation, processed with MCIP v.1 23 layer MM5 averaged to 18 layers. Chemistry: CB-IV with extensions SO2 oxidation into sulfate aerosol VOC oxidation into secondary organic aerosol Coupled with RADM aqueous chemistry Advection scheme is PPM CMAQ Description: April 2001 release
SMOKE is used for emissions processing. Ported SMOKE to Linux Quality Assurance: SMOKE QA reports Post processing to total emissions subcategories for all layers and all hours. Emissions Processing
IMPROVE database: Raw Dataset Analysis period: Year 1996 total of 104 days available ambient data Raw: ~53 stations Evaluation species SO4, NO3, Bext, PM2.5, PM10, OC, EC Evaluation Overview
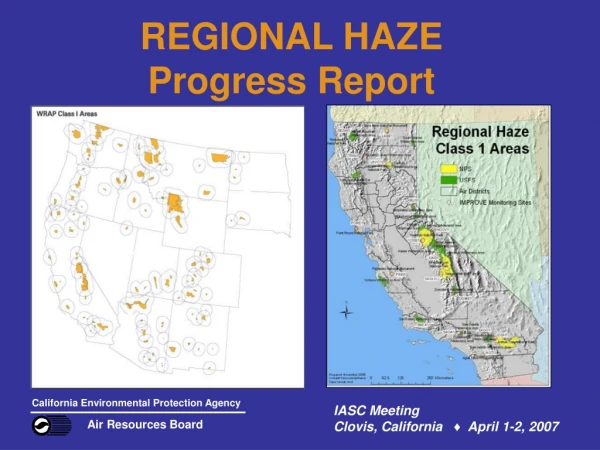
with 1996 IMPROVE Data No 1996 IMPROVE Data IMPROVE & Protocol Sites for Evaluation
with 1996 CASTNET Data No 1996 CASTNET Data CASTNET Sites for Evaluation
Analysis procedures: Compute daily averaged model level-one concentration. Extract species information & concentration from IMPROVE datasets Identify monitoring sites within model domains (convert lat/lon into grid cell) Match model predictions with IMPROVE datasets Generate scatter plots and time-series plots of model results vs. IMPROVE datasets. Modeling Evaluation Procedure
Time series data Scatter plots All Site and All Days All Site for One Day All Days for One Site All Days for Defined Sub-regions Statistical analysis Regression (r-squared) Mean normalized bias (MNB) and error (MNE) Results from Analysis Program(complete results at: www.cert.ucr.edu/rmc)
Annual Time-Series Plots – SO4 Bryce Canyon, UT Grand Canyon, AZ
Annual Time-Series Plots – NO3 Bryce Canyon, UT Grand Canyon, AZ
Annual Time-Series Plots – OC Bryce Canyon, UT Grand Canyon, AZ
Annual Time-Series Plots – EC Bryce Canyon, UT Grand Canyon, AZ
Annual Time-Series Plots – SOIL Bryce Canyon, UT Grand Canyon, AZ
PM2.5 mass composition at Grand Canyon Nat’l Park, AZ - Summer
PM2.5 mass composition at Grand Canyon Nat’l Park, AZ - Winter
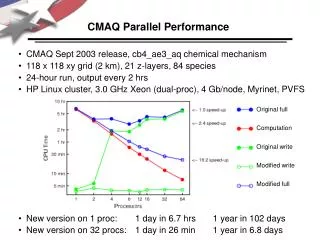
Model over predicts most species in the winter. Model performance is best in summer. Model does not get the peaks on the correct day: Precedent from SAMI longterm regional O3 model Should consider “unpaired in time & space” evaluation. Coarse mass is under predicted Missing windblown dust emissions inventory. Many upgrades planned for Section 308 modeling. Conclusions for 1996 Model Performance Evaluation
EPA modeling showed strong seasonality in NH3 emissions: We reduced winter NH3 emissions by 50% This reduced the NO3 over prediction to be consistent with other species. Still need to explore winter vertical mixing. Western BC were too high Reduced western BC based on IMPROVE data at clean western sites. Sensitivity Runs