Download
1 / 1
10 likes | 179 Vues
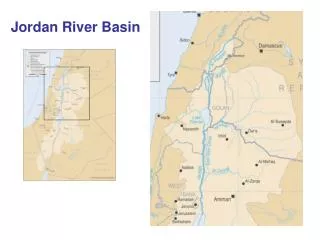
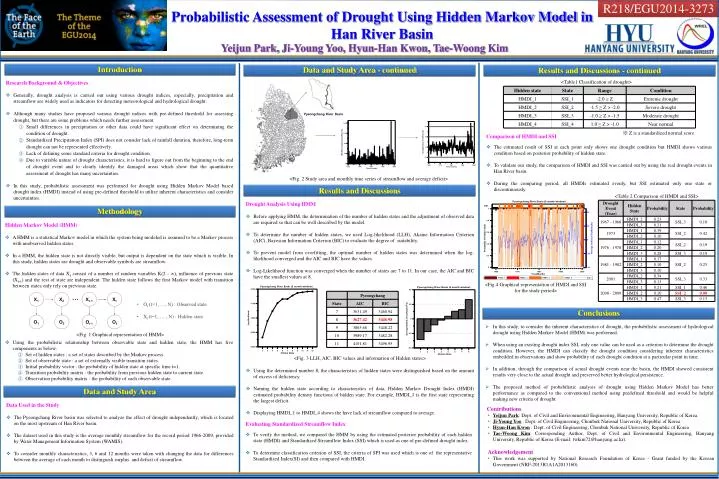
R218/EGU2014-3273. Probabilistic Assessment of Drought Using Hidden Markov Model in Han River Basin. Pyeongchang River Basin. Yeijun Park, Ji -Young Yoo , Hyun-Han Kwon, Tae- Woong Kim. Introduction. Data and Study Area - continued. Results and Discussions - continued.

E N D
R218/EGU2014-3273 Probabilistic Assessment of Drought Using Hidden Markov Model in Han River Basin Pyeongchang River Basin Yeijun Park, Ji-Young Yoo, Hyun-Han Kwon, Tae-Woong Kim Introduction Data and Study Area - continued Results and Discussions - continued <Table1 Classification of drought> • Research Background & Objectives • Generally, drought analysis is carried out using various drought indices, especially, precipitation and streamflow are widely used as indicators for detecting meteorological and hydrological drought. • Although many studies have proposed various drought indices with pre-defined threshold for assessing drought, but there are some problems which needs further assessment. • Small differences in precipitation or other data could have significant effect on determining the condition of drought. • Standardized Precipitation Index (SPI) does not consider lack of rainfall duration, therefore, long-term drought can not be represented effectively. • Lack of defining some standard criteria for drought condition. • Due to variable nature of drought characteristics, it is hard to figure out from the beginning to the end of drought eventand to clearly identify the damaged areas which show that the quantitative assessment of drought has many uncertainties. • In this study, probabilistic assessment was performed for drought using Hidden Markov Model based drought index (HMDI) instead of using pre-defined threshold to utilize inherent characteristics and consider uncertainties. ※ Z is a standardized normal score • Comparison of HMDI and SSI • The estimated result of SSI at each point only shows one drought condition but HMDI shows various condition based on posterior probability of hidden state. • To validate our study, the comparison of HMDI and SSI was carried out by using the real drought events in Han River basin. • During the comparing period, all HMDIs estimated evenly, but SSI estimated only one state or discontinuously. <Fig. 2 Study area and monthly time series of streamflow and average deficit> Results and Discussions <Table 2 Comparison of HMDI and SSI> • Drought Analysis Using HMM • Before applying HMM, the determination of the number of hidden states and the adjustment of observed data are required so that can be well described by the model. • To determine the number of hidden states, we used Log-likelihood (LLH), Akaine Information Criterion (AIC), Bayesian Information Criterion (BIC) to evaluate the degree of suitability. • To prevent model from overfitting, the optimal number of hidden states was determined when the log-likelihood converged and the AIC and BIC have the values. • Log-Likelihood function was converged when the number of states are 7 to 11. In our case, the AIC and BIC have the smallest values at 8. Methodology • Hidden Markov Model (HMM) • A HMM is a statistical Markov model in which the system being modeled is assumed to be a Markov process with unobserved hidden states. • In a HMM, the hidden state is not directly visible, but output is dependent on the state which is visible. In this study, hidden states are drought and observable symbols are streamflow. • The hidden states of data Xt consist of a number of random variables K(2 - ∞), influence of previous state (Xt-1) and the rest of state are independent. The hidden state follows the first Markov model with transition between states only rely on previous state. <Fig.4 Graphical representation of HMDI and SSI for the study period> • Ot (t=1, …, N) : Observed state • Xt(t=1, … , N) : Hidden state Conclusions • In this study, to consider the inherent characteristics of drought, the probabilistic assessment of hydrological drought using Hidden Markov Model (HMM) was performed. • When using an existing drought index SSI, only one value can be used as a criterion to determine the drought condition. However, the HMDI can classify the drought condition considering inherent characteristics embedded in observations and show probability of each drought condition at a particular point in time. • In addition, through the comparison of actual drought events near the basin, the HMDI showed consistent results very close to the actual drought and preserved better hydrological persistence. • The proposed method of probabilistic analysis of drought using Hidden Markov Model has better performance as compared to the conventional method using predefined threshold and would be helpful making new criteria of drought. <Fig. 1 Graphical representation of HMM> • Using the probabilistic relationship between observable state and hidden state, the HMM has five components as below: • Set of hidden states: a set of states described by the Markov process. • Set of observable state : a set of externally visible transition states. • Initial probability vector: the probability of hidden state at specific time t=1. • Transition probability matrix: the probability from previous hidden state to current state. • Observation probability matrix : the probability of each observable state. <Fig. 3 LLH, AIC, BIC values and information of Hidden states> • Using the determined number 8, the characteristics of hidden states were distinguished based on the amount of excess of deficiency. • Naming the hidden state according to characteristics of data, Hidden Markov Drought Index (HMDI) estimated probability density functions of hidden state. For example, HMDI_1 is the first state representing the largest deficit. • Displaying HMDI_1 to HMDI_4 shows the have lack of streamflow compared to average. Data and Study Area • Data Used in the Study • The PyeongchangRiver basin was selected to analyze the effect of drought independently, which is located on the most upstream of Han River basin. • The dataset used in this study isthe average monthly streamflowfor the record period 1966-2009, provided by Water Management Information System (WAMIS). • To consider monthly characteristics, 3, 6 and 12 months were taken with changing the data for differences between the average of each month to distinguish surplus and deficit of streamflow. • Contributions • Yeijun Park: Dept. of Civil and Environmental Engineering, Hanyang University, Republic of Korea. • Ji-Young Yoo : Dept. of Civil Engineering, Chonbuk National University, Republic of Korea • Hyun-Han Kwon : Dept. of Civil Engineering, Chonbuk National University, Republic of Korea • Tae-WoongKim: Corresponding Author, Dept. of Civil and Environmental Engineering, Hanyang University, Republic of Korea (E-mail: twkim72@hanyang.ac.kr). • Acknowledgement • This work was supported by National Research Foundation of Korea - Grant funded by the Korean Government (NRF-2013R1A1A2013160) • Evaluating Standardized Streamflow Index • To verify the method, we compared the HMM by using the estimated posterior probability of each hidden state (HMDI) and Standardized Streamflow Index (SSI) which is used as one of pre-defined drought index. • To determine classification criterion of SSI, the criteria of SPI was used which is one of the representative Standardized Index(SI) and then compared with HMDI.