Download
1 / 41
480 likes | 952 Vues
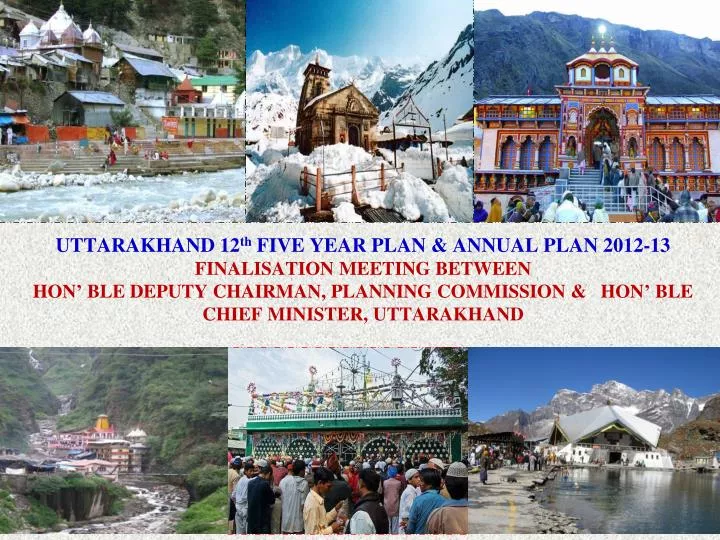
UTTARAKHAND 12 th FIVE YEAR PLAN & ANNUAL PLAN 2012-13 FINALISATION MEETING BETWEEN HON ’ BLE DEPUTY CHAIRMAN, PLANNING COMMISSION & HON ’ BLE CHIEF MINISTER, UTTARAKHAND. Uttarakhand Symbols. UTTARAKHAND AT A GLANCE. Decadal Changes in Demographic Indicators in Uttarakhand.

E N D
UTTARAKHAND 12th FIVE YEAR PLAN & ANNUAL PLAN 2012-13 FINALISATION MEETING BETWEEN HON’ BLE DEPUTY CHAIRMAN, PLANNING COMMISSION & HON’ BLE CHIEF MINISTER, UTTARAKHAND
Census 2011 findings • Even though the literacy rate in Uttarakhand is 5.5 % points higher than all India average, the state has slipped by 3 positions to 17th in 2011. • The population of Districts of Almora & Garhwal (Pauri) has shown negative growth by -1.73 % and -1.51 % respectively. The Hill districts have shown very low growth rates.This highlights the trend of migration from the hills. • Sex ratio is almost constant at 963 (962 in 2001 Census). But child sex ratio has deteriorated from 908 to 886 .
Despite global recession the state has maintained steady growth. GSDP of Uttarakhand at constant pricesof 2004-05(new series) P= Provisional, Q=Quick, A=Advance estimates
Change in Sector-wise Composition (% share) of GSDP (Uttarakhand) Source : CSO/Directorate of Economics & Statistics, Uttarakhand
12th FYP & Annual Plan 2012-13Required Plan Investment • 11 % average Annual growth rate of income had been envisaged during 2012-17. Given the global outlook, this rate might have to be revisited. • Assuming incremental capital output ratio of 4.25 : 1, total investment of Rs. 1,63,270 crore is required during 12th FYP for achieving this growth rate. • We have assumed fulfillment of 60 per cent of investment from private sector and 40 per cent from public, total private sector outlay of Rs.97,970 Crores and a public sector Outlay of Rs.65,300crore is needed for 12th Five Year Plan. • The entire amount of FYP Outlay has been distributed in the ratio of 16 %, 18%, 20%, 22% and 24% for successive years. • Going by the above assumptions, the Outlay for Annual Plan 2012-13 (@16% of Five Year Plan) works out as Rs. 10,450 crore. However, given the State’s resource position, the Annual Plan (2012-13) had been pegged at Rs.8,212.60 Crores, assuming a SCA of Rs.2400 Crores.
State’s Financial Woes • The State has inherited a financial situation of a negative BCR (Balance from Current Revenues) of Rs.1277 Crores in the FY 2012-13 which completely eliminates any scope for initiating new schemes without counterpart Additional Central Assistance.
Financial Woes • The Non-Plan expenditure has ballooned from Rs.6300 Crores in FY 2007-08 to Rs.12,838 Crores in the FY 2011-12 eliminating the fiscal space for funding the Plans. • Being a new State, much of this expenditure has been on filling up essential manpower for ensuring service delivery under the various Central and State Schemes. • Given our unique geographical situation, the economies of scale do not operate as they do in many of the other States and this increases the per capita administrative cost of service delivery. This has considerably handicapped our efforts in containing the increasing non-plan expenditure.
Financial Woes • The13th Finance Commission recommendations have further added to our woes. Our share of total devolutions (as compared to devolutions under 12th FC) decreased from 1.61 % to 1.19 % which is the second highest loss among all States. • This translates into a loss of approximately Rs.7343 Crores over the five year period. In per capita terms, the increase in devolution for Uttarakhand under the 13th FC is the lowest among the Special Category States.
Outlay Proposed for Annual Plan 2012 -13 • Proposed Outlay -Rs 8212.60 crores • State Resources - Rs 5812.60 crore • SCA (Untied) required to • bridge gap between State Plan - Rs.2400.00 Crores • and State Resources
OUR REQUEST Central Assistance needed in addition to Rs.2400 Cr above
Physical Performance of Main Sectors • Power Generation capacity has increased from 1115 MW in 2000-01 to 3618 MW in 2011-12. In addition, work on projects of 3493 MW is in progress. • Rapid industrialization :-
………… Contd Physical Performance of Main Sectors • Literacy percentage has improved to 79.6 % from 71.6% . • In terms of access, Uttarakhand is fast approaching saturation in Elementary Education and improving in Secondary Education . Access is 96% for Primary, 98% for Upper Primary and 83% at Secondary level. • In terms of enrolment, almost 99% children are in elementary school system and above 70% in secondary level.
………… Contd Physical Performance of Main Sectors • In the field of Higher Education 07 State Universities, 06 Private Universities, 04 Deemed Universities (apart from 01 IIT, 01 NIT, 01 IIM) have been established. • In the field of Medical Education 02 Medical Colleges have been established. 03 Medical Colleges are in pipeline. Apart from it, 05 Nursing Colleges are being set up. • The CD ratio has improved and increased to 53% in June, 2011 from 20 % in 2001 • 99% rural electrification as per the norms of RGGVY. • About 10,000 KM. roads had been constructed after formation of the State (which have been devastated after the unprecedented rains/floods of 2010).
Health Indicators According to latest SRS Bulletin (December, 2011) State is comparatively better in Birth Rate, Death Rate & IMR.
State’s PPP Initiative PPP Projects Summary PPP Enabling Environment Summary
Funding of CSS on 90:10 basis • 38 Centrally Sponsored Schemes are not on 90:10 pattern. This will cost the State approximately 500 Cr this year in additional allocations. • Request that these 38 Schemes are brought into the 90:10 funding pattern.
CSS Funding (contd/-) • SarvaShikshaAbhiyan is being run on 65:35 basis while RMSA is being run on a 75:25 basis. • The non-refunding of fees paid to the 25 % students admitted under RTE is placing a heavy burden on the State. • Even though the cost of service delivery in this sector is almost 2 to 3 times the national average, there is no assistance from the Central Government in this regard. • The arbitrary fixing of norms under RMSA (@Rs.7000/- per sq m) instead of the State Schedule of rates has rendered this programme a 50:50 Scheme. • Therefore, Either the SOR prevailing in the state should be permitted for construction of RMSA /Model Schools as relaxed under SSA looking at the cost increase due to height and distance or change in prescribed design as per the conditions and need of the state may be granted.
Contd CSS Funding - PMGSY - The Burden of cost escalation Rishikesh – Gangotri Road to Baun Motor Road (Uttarkashi) Length : 5.95 Km • Although PMGSY is fully funded by Centre , yet State Government has to arrange fund for: • (i) NPV (ii) Compensation for land & buildings (iii) cost and time overrun due to delay in FC Clearance (iv) payment for construction of bridges over 50 meter span. • During 2006-07—2010-11 Government of India provided Rs. 859 crore for PMGSY. Against which the State of Uttarakhand had to make provision of Rs. 372 crore. Thus the actual ratio is 70:30 instead of 100 % funding. ThereforeCost escalation due to difficult topography of the region and delayed forest clearance in PMGSY should be factored in and given as part of Central Share. Hon’ble Minister for Rural Development had agreed to look into funding 50 % of NPV cost from GoI.
We face the brunt of heavy rains, cloud-bursts and floods. The AIBP guidelines do not provide for soil conservation or flood control. AIBP as it stands, is biased favourably towards the Plain States. Being a hill-State, we would appreciate a Comprehensive Water Management Programme which would look at irrigation, flood control, water recharging and soil conservation measures in a holistic way. The AIBP focuses on Command Area Development but if the Command Area itself is washed away, then whither AIBP ? Further, due to small and scattered landholdings in hills, it is very difficult to obtain Benefit-Cost ratio of 1:1. Hence the norm should be relaxed to 0.5:1 for hills. in valleys the construction of mini tube wells should be permitted under AIBP. Reinventing AIBP as a Comprehensive Water Management Programme 27 27
Areas of Concern – Eco Services • The State renders ecological services to the country which has been estimated by various studies to be between Rs.25,000-40,000 crore per annum. • Uttarakhand Economic Assessment Report (June, 2012) says“..there are vast opportunities to generate revenues from…ecological services, the 13th Finance Commission has made explicit provisions to compensate the State..although, as yet, at a low level that does not value them accurately.” • The 13th FC not only pegged the grant at a meagre Rs.41 Crores p.a. for 5 years but also tied it to spending on forests, depriving us of any free float.
Eco-Services • There is a clear need for proper valuation of such services to the nation and these should be included in the National Accounting System and should figure in the formula for devolution of resources to the States. • A national exchange could be created where green credits can be bought by green deficit States. Such a mechanism is available globally. Or, in the alternative, till such mechanisms come into play, our State can be incentivised by grant of ACA. • Global Yardstick of “Polluter Pays” and “Preserver be compensated” should be followed.
Burden of FCA • Since 65% forest area is covered by forest, very limited area is left for development activities thus, thwarting our efforts for development. • Several disabilities and incapacities imposed by environmental concerns but no compensatory mechanism in place. • Heavy burden of NPV and compensatory afforestation. • Harnessing of hydro power which could have been the mainstay of the State hampered on the ground of ecological concerns. • Delay in getting clearances under Forest Conservation Act results in cost over run & time over run. 165 projects are awaiting clearance.
Major works and plan schemes hampered by Forest Conservation Act and environmental issues :- iii) The work of 400 KV Loharinagpala-Koteshwar transmission line has been stopped due to cancellation of above mentioned 03 power generation projects. iv) Development works and livelihoods in Bhagirathi valley (Uttarkashi-Gangotri) will be seriously affected by proposed eco-sensitive zone. 31
An example of Burden under FC Act • The cost of construction of a km of motor road in the hills costs Rs.46 lakhs (Cost per km in Plains -Rs.28 lakhs). • 26.9 or 27 % of this cost is on account of forest and related clearances. • NPV – Rs.5.4 lacs, Compensatory Afforestation – Rs.1.00 lacs, Muck Disposal – Rs.5.00 lacs, Roadside Plantation Rs.1 lac, total – Rs.12.40 lacs. • Why burden a green surplus state with these levies and inflate the per km cost by 27 %?
Strategic Imperatives • Uttarakhand is mainly hilly & border State. The State has 625 km long border (350 km sensitive border with China and 275 km border with Nepal). This is 9 % and 16 % of India’s total border with China and Nepal respectively. • Out of 13 districts, 05 districts are border districts. Around 47 % area is under these border districts.
Areas of Concern - Power • Compared to an estimated Potential of 27000 MW, State has been able to develop only 3618 MW. Power is one of our GDP Drivers. • However, much of our hydro power capacity will not see the light of the day due to “a combination of pressure from environmentalists, religious groups upset at the alleged despoilation of rivers….”
Power • The problems in the hydropower sector are due to delayed Forest/Environmental clearances, post clearance stoppage of work which creates an atmosphere of uncertainty for investors and the State Government. • Monetisation of the Power output of these projects put on hold works out to Rs.1651 Crores p.a. which may kindly be given as ACA till such time these projects are cleared • There should be a time limit for grant of such clearances and they should have some finality.
Issues - migration • The 2011 Census reveals migration from all hill districts of the State. Excepting two Hill Districts, all others hover around a population growth rate of 5 % with Almora and Pauri Districts showing a negative population growth of -1.73 % and -1.51 % respectively against a national average of 17 %. • This reflects the absence of livelihood opportunities in the Hills and yearning for a better quality of life.
The Concessional Industrial Package (CIP), which was prematurely withdrawn, not only boosted the industrial growth but the entire economy, which grew @ 14 % during CIP. • Revival of the Package will not only boost the economy but go a long way to curb migration from the State, by creating employment opportunities within the State
Issue – Need for Comprehensive Road Replacement Package About 14000 km . Motor roads & 1000 km. bridle path damaged during monsoon 2010 and 2011.We seek a Comprehensive Road Replacement Package amounting to Rs.800 Crores per annum for current financial year and financial year 2013-14 in the form of ACA to repair and replace the above damage. 39
Special Disaster Mitigation Assistance More than 200 villages are situated at mouth of lands slides. Re-settlement and rehabilitation of these villages need huge resources. We seek ACA of Rs 500 Crores to relocate and rehabilitate these villages before the disaster strikes. Contd. 40