Download
1 / 22
220 likes | 699 Vues
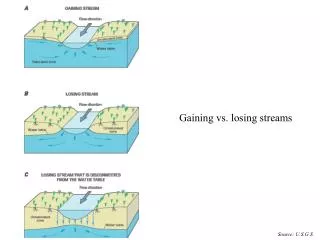
Young Streams vs. Old Streams. Young Streams vs. Old Streams. How river systems change from young to mature!. MATURE Wide Channels Large floodplains Lateral erosion Gentle slopes Meanders, oxbows Fine sediment. YOUNG. Narrow channels Small floodplains Downcutting Steep slopes

E N D
Young Streams vs. Old Streams Young Streams vs. Old Streams
How river systems change from young to mature! MATURE • Wide Channels • Large floodplains • Lateral erosion • Gentle slopes • Meanders, oxbows • Fine sediment YOUNG • Narrow channels • Small floodplains • Downcutting • Steep slopes • Rapids, waterfalls • Coarse sediment
YOUNG Stream • V – shaped valleys • Erodes away at bed (more than sides) • Waterfalls and Rapids are common. • Few Tributaries
OLD Rivers • Well established tributaries • Drains effectively • Carries LARGE amounts of water • Does not get deeper, (Erodes from Sides)
YOUNG Stream Mature Stream/River OLD River
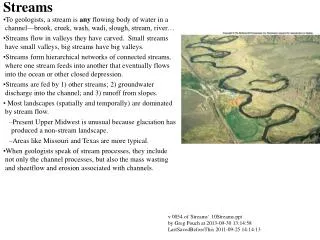
FLOODS • Stream overflows channel • Causes • Weather events • Dams break • (+) Provides “fertilizer” for floodplain • (-) Most destructive of all geologic hazards
Missouri & Mississippi Rivers (Satellite view near St. Louis)
Describe human decisions that increase the risk of flooding. • Disturbing vegetation that uses water and returns it to the atmosphere before flooding occurs. • Building • Grazing animals • Farming practices like clear-cutting land • Cutting down forests
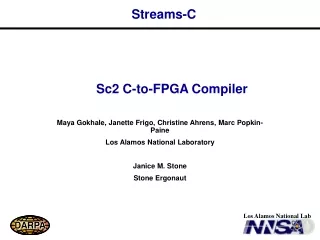
FLOOD CONTROL Dams
Glen Canyon Dam, Page, AZ (Lake Powell in background, Colorado River in foreground)
LAG TIME • The time difference between when heavy precipitation occurs and when peak discharge occurs in the streams draining area. • Urban • Lots of pavement, buildings, etc. • Causes very quick movement of water into river system • “Flash Flood” • Rural • Lots of farm land, less roads and buildings • Slower movement of water, more absorbed by soil
3 ways to prevent flooding Look over attached handout: • Dams • Artificial Levees • Channels
Trace the path(s) that 99% of water travels through the Great Lakes watershed. USE Michigan Waterways handout
CANADA Nipigon Bay Jackfish Bay Thunder Bay Silver Bay St. Mary’s R. St. Lawrence R. Spanish R. St. Louis R. MICHIGAN Penetary Bay Sturgeon Bay WISCONSIN MICHIGAN Saginaw Bay NEW YORK Niagara Falls Saginaw R. System Grand R. MINNESOTA Niagara R. St. Clair R. Thames R. Buffalo R. Detroit R. Rouge R. Raisin R. Ashtabula R. PENNSYLVANIA IOWA Cuyahoga R. Maumee R. Rocky R. Black R. ILLINOIS INDIANA OHIO Great Lakes drainage basin Most polluted areas, according to the Great Lakes Water Quality Board “Hot spots” of toxic concentrations in water and sediments Eutrophic areas Fig. 19.7, p. 484