Download
1 / 20
200 likes | 334 Vues
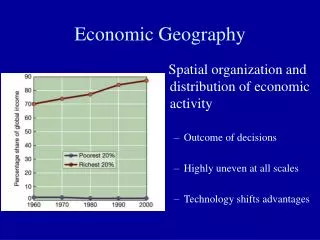
Higher Geography Interactions: Development and Health. DEVELOPMENT INDICATORS ECONOMIC INDICATORS: AVERAGE ANNUAL INCOME RELATIVE PUCHASING POWER GNP PER CAPITA / GDP PER CAPITA ($). SOCIAL INDICATORS: HEALTH RELATED: LIFE EXPECTANCY; INFANT MORTALITY RATE; BIRTH RATE / DEATH RATE;

E N D
Higher Geography Interactions: Development and Health
DEVELOPMENT INDICATORS • ECONOMIC INDICATORS: • AVERAGE ANNUAL INCOME • RELATIVE PUCHASING POWER • GNP PER CAPITA / GDP PER CAPITA ($)
SOCIAL INDICATORS: HEALTH RELATED: LIFE EXPECTANCY; INFANT MORTALITY RATE; BIRTH RATE / DEATH RATE; No. of PEOPLE PER DOCTOR; No. of PEOPLE PER HOSPITAL BED; ACCESS TO CLEAN WATER; AVERAGE CALORIE INTAKE
EDUCATION RELATED: ADULT LITERACY RATE; ACCESS TO PRIMARY, SECONDARY, HIGHER EDUCATION; No. of PEOPLE PER TEACHER POSSESSIONS /LUXURY GOODS RELATED: No. of PEOPLE PER T.V.; No. of PEOPLE PER CAR; No. of PEOPLE PER TELEPHONE; No. of PEOPLE PER NEWSPAPER;
WORK RELATED: % of POPULATION IN PRIMARY/SECONDARY/TERTIARY
COMBINED OR COMPOSITE INDICATORS: • These numbers are combined statistics, which offer a more accurate picture of the true quality of life within a country • PQLI – PHYSICAL QUALITY OF LIFE INDEX • (Life Expectancy, Infant Mortality rate and Adult Literacy Rate) • 0-100 : below 77 has significant problems
2. United Nations HDI – HUMAN DEVELOPMENT INDEX. This is a more sophisticated composite indicator than the PQLI: it looks at a country’s development in terms of (i) the Purchasing Power of money (so cost of living is taken into account); Adult Literacy Rate and Average Number of Years’ Schooling; and Life Expectancy. This gives a better general view of development because it covers income, education and health care – the main areas where the level of development of a country can be measured and the most important for determining the true quality of life of the people. Scale goes from 0 – 10, with 10 the highest, although sometimes it’s given as a % e.g. 60% or as a decimal fraction e.g. 0.60
Top Ten Countries with Highest Life Expectancy: Andorra (in France): 83.51 Macau (near China): 82.19 San Marino (in Italy): 81.71 Singapore: 81.81 Hong Kong: 81.59 Japan: 81.25 Sweden: 80.51 Switzerland: 80.51 Australia: 80.50 Guernsey (in the English Channel): 80.42
Worst Ten Countries by Life Expectancy: Swaziland: 32.63 Botswana: 33.74 Lesotho: 34.40 Zimbabwe: 39.29 Liberia: 39.65 Mozambique: 39.82 Zambia: 40.03 Sierra Leone: 40.22 Malawi: 41.70 South Africa: 42.73 Djibouti: 43.17
Other Countries of Interest: Canada: 80.22 Italy: 79.81 France: 79.73 Germany: 78.80 United Kingdom: 78.54 United States: 77.85 Mexico: 75.41 China: 72.58 Iraq: 69.08 Russia: 67.08
LEDCs -REASONS FOR INEQUALITY BETWEEN COUNTRIES LOCATION, CLIMATE AND LANDSCAPE (Afghanistan) NATURAL RESOURCES (Afghanistan, Saudi Arabia) NATURAL DISASTERS (Bangladesh, Mozambique) DIFFERENT LEVELS OF DEVELOPMENT HISTORY / COLONISATION (Brazil, Peru / India / many African countries) DEBT (Brazil) INDUSTRY AND TRADE (“Tiger” economies of S.E. Asia) POLITICS (N. Korea / S. Korea)
Reasons for Differences in Development within LEDCs. • “Explain why indicators of development such as those shown may fail to reflect accurately the true quality of life within (or throughout) a country”. • General points: • Economic indicators such as G.N.P. or average income tend to make countries where most people are involved in farming, especially subsistence farming look poorer than they actually are, because they may have few exports and little industrial production – the main sources for working out these statistics. In reality, if they have sufficient food, and no major problems such as widespread disease and are free from the effects of major natural disasters, their true quality of life may be higher than it first appears.
2. Economic indicators may ignore the cost of living. This can greatly affect the value of money. e.g. the wages in Japan may be very high compared to the U.K., but everything is also much more expensive; or the wages in a developing country may be much lower, but the cost of living is also much lower - so figures alone may not give a clear picture. • 3. People in many countries don’t measure quality of life in terms of income or material goods, but in terms of number of children, number of wives or even number of cattle! • 4. Development Indicator statistics such as G.N.P.Average Income, or Life Expectancy are usually national figures i.e. averages for a whole country. Because they are averages, they tend to mask huge variations that can occur within a country. Don’t just say some people will be earning more than average and some less – this is too simplistic an answer. Be specific:-
Specific points: Try to structure your answer to this type of question using distinct headings and examples. A useful structure might be the following – • Regional variations – variations between different parts of a country: • Example: Brazil • North (Amazonia) • - remote, hostile environment • - 2% of National Industrial Production • - 2% of National income • North East • - drought, rural poverty • 16% of National Industrial Production • 14% of National Income • South East • - industrial cities, ports, trade • - 55% of National Industrial Production • - 64% of National Income
2. Rural / Urban variations - variations between the countryside and cities: Example: India Rural - Subsistence farming, poor access to clean water and sanitation; very low wages, poor health and education, few prospects. Urban - Mumbai (Bombay) – many millionaires; high standard of living in some parts of the city; good water supply and sanitation in some city districts; major port and industrial area; centre of Indian film industry (“Bollywood”);
3. Individual variations – variations between different groups of the population Examples: Saudi Arabia Rich: The Saudi royal family (a tribal grouping), control the vast wealth earned by Saudi Arabia’s oil exports. Many of these Saudi princes are among the world’s wealthiest people. Poor: The wealth is not evenly spread: the majority of the Saudi population still live in poverty. India The caste system in India’s mainly Hindu population puts people into social and economic categories from birth and makes it very difficult, if not impossible, for people to improve their lives. (highest caste – Brahmins; lowest – unscheduled or “untouchables”) REMEMBER … REGIONAL, RURAL / URBAN, INDIVIDUAL VARIATIONS