Download
1 / 6
60 likes | 167 Vues
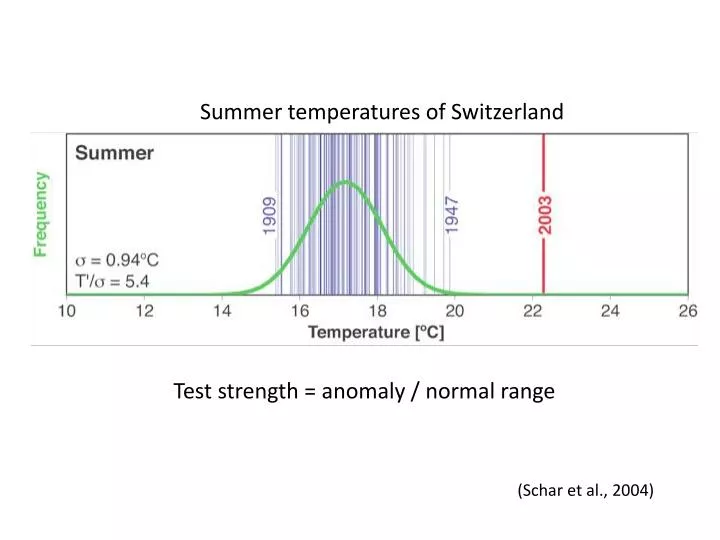
Summer temperatures of Switzerland. Test strength = anomaly / normal range. ( Schar et al., 2004). Identification of climate change signal. Simple pattern is desired for statistical significance

E N D
Summer temperatures of Switzerland Test strength = anomaly / normal range (Schar et al., 2004)
Identification of climate change signal. • Simple pattern is desired for statistical significance • Must “detect” signal from climate models … problem of separability of signal definition and signal detection. • Determination of the relevant statistical properties of the natural climate variability background. • Observations can be “corrupted” by signal. • Not nearly enough data exists • Development of optimal detection method. • What index would be the most sensitive? • Optimal Fingerprint = weighted linear combination of all variables that maximizes signal to noise ratio. • Depending on metric, more data is *not* always better. • Pattern correlation maximizes explained variance, not signal to noise. Klaus Hasselmann Hasselmann 1993, Journal of Climate
Four criteria for usefulness of variable to use for detection • High signal-to-noise ratios (determined from model sensitivity experiments) • Good • Temperature • Atmospheric moisture content • Bad • Precipitation • Sea level pressure • Field should be easy to predict (not model specific). Precipitation is noteworthy for being bad. (powerpoint example from Cook et al., 2008) • Signal should be easily distinguished from other possible forcings and from natural variability. • Many forcings affect near surface temperature • Upper troposphere/lower stratosphere atmosphere temperature changes are strongly affected by greenhouse gases, but has a lot of natural variability. • Need long records, preferably on 100-year time scale. • Only surface-based data have long records. • Only surface air temperature has sufficiently large signal to noise ratio. Phil Jones, University of East Anglia
Projections of changes in atmospheric circulation are similar. Cook et al., 2008, Journal of Climate
Projections of changes in precipitation are quite different. Cook et al., 2008, Journal of Climate