Download
1 / 17
170 likes | 181 Vues
Quantitative Analysis: Basics. Sebastian M. Rasinger Quantitative Research in Linguistics. An Introduction 2 nd edition. 2013. London: Bloomsbury. Agenda. Statistics – what for? Quantitative data – what, how, why? Descriptive statistics frequencies Measures of location

E N D
Quantitative Analysis: Basics Sebastian M. Rasinger Quantitative Research in Linguistics. An Introduction 2nd edition. 2013. London: Bloomsbury S.M.Rasinger. 2013. Quantitative Research in Linguistics. 2e. Bloomsbury.
Agenda • Statistics – what for? • Quantitative data – what, how, why? • Descriptive statistics • frequencies • Measures of location • Measures of dispersion • Relationships between variables S.M.Rasinger. 2013. Quantitative Research in Linguistics. 2e. Bloomsbury.
What is statistics? • Any orderly summary of numbers, e.g. results of an election, league table etc • Numerical measurement describing some characteristic of a sample • Collection of methodological tools which help to systematically and exemplarily collect, process and display information, e.g. inflation rate, unemployment rate S.M.Rasinger. 2013. Quantitative Research in Linguistics. 2e. Bloomsbury.
Statistics as a basis for decisions • Numerous possibilities to process an issue statistically problem of measurement • Different interpretation of results: glass half empty or half full? • Manipulation of raw data S.M.Rasinger. 2013. Quantitative Research in Linguistics. 2e. Bloomsbury.
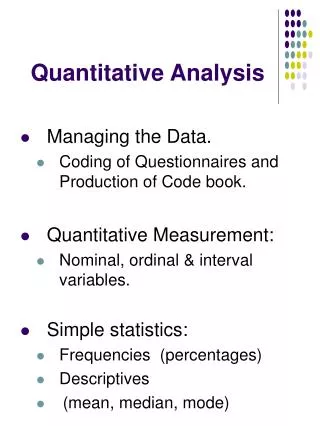
Statistics: 3 purposes • Description: • Quantifying and summarising information in order to describe and display an issue in the most effective and optimal manner: tables, graphs, main statistical values • Aim: describing the reality S.M.Rasinger. 2013. Quantitative Research in Linguistics. 2e. Bloomsbury.
Statistics: 3 purposes (cont’d) • Generalisation: • Inference: inferring information about the population via a small sample Population sample S.M.Rasinger. 2013. Quantitative Research in Linguistics. 2e. Bloomsbury.
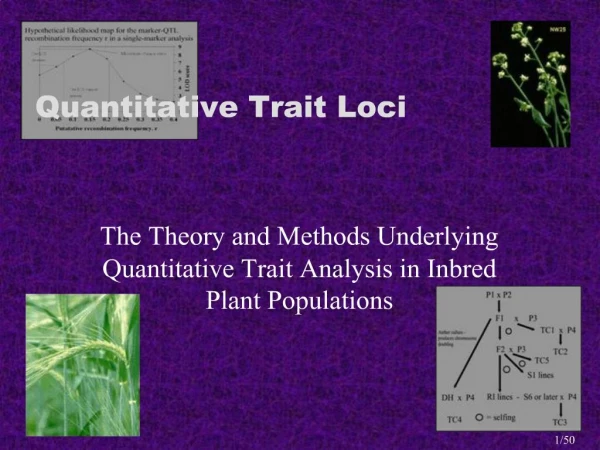
Statistics: 3 purposes (cont’d) • Identification of causal relationships, i.e. how two (or more) phenomena are related • e.g. effect of learner’s age on language attainment S.M.Rasinger. 2013. Quantitative Research in Linguistics. 2e. Bloomsbury.
Quant. Data: discrete or continuous • Discrete: finite or countable number of possible values • E.g. numbers of students in a class (there’re no half students…) • Continuous: infinitely many possible values on a continuous scale without gaps/interruptions • E.g. amount of coffee a university lecturer drinks a day: continuous (e.g. 1.256 litres) S.M.Rasinger. 2013. Quantitative Research in Linguistics. 2e. Bloomsbury.
Levels of measurement • Nominal data: • names, labels, categories. Cannot be arranged in high/low scheme, e.g. sex • Ordinal data: • Data may be arranged in some order, but differences between value cannot be determined or are meaningless, • e.g. ‘good’ – ‘average’ – ‘poor’ rankings S.M.Rasinger. 2013. Quantitative Research in Linguistics. 2e. Bloomsbury.
Levels of measurement (2) • Interval data: • meaningful difference between data, but no natural zero starting point for when no quantity is present, e.g. Fahrenheit: 0° doesn’t mean no heat • Ratio data: • Natural zero point, e.g. length of lecture in minutes: 0 minutes = no lecture S.M.Rasinger. 2013. Quantitative Research in Linguistics. 2e. Bloomsbury.
Absolute and Relative frequency • Students on a year 1 UG course achieved the following results in an exam Absolute frequency S.M.Rasinger. 2013. Quantitative Research in Linguistics. 2e. Bloomsbury.
Absolute & Relative frequency (2) • Relative frequency: Where n is the total number of items/observations in a sample S.M.Rasinger. 2013. Quantitative Research in Linguistics. 2e. Bloomsbury.
Relative frequency Percentage: relative frequency x 100 S.M.Rasinger. 2013. Quantitative Research in Linguistics. 2e. Bloomsbury.
Summarizing data: classes and class width • The following table shows the number of students for 20 courses over the last year • No obvious classes. Useless information. • Determine number of non-overlapping classes • Determine the width of each class • Determine the class limits S.M.Rasinger. 2013. Quantitative Research in Linguistics. 2e. Bloomsbury.
Classes and class width • 20 observations 5 classes reasonable • Width of classes • Class limits • Lower limit: smallest possible value in a class • Upper limit: largest possible value in a class • Number of classes, width and limits depend on researcher’s judgement S.M.Rasinger. 2013. Quantitative Research in Linguistics. 2e. Bloomsbury.
Classes and class width (cont’d) Class intervals Frequency Relative frequency 10-14 4 0.20 15-19 8 0.40 20-24 5 0.25 25-29 2 0.10 30-34 1 0.05 Total 20 1 S.M.Rasinger. 2013. Quantitative Research in Linguistics. 2e. Bloomsbury.
Cumulative frequencies • Running total of frequencies through all classes Class intervals f Rf cf cRf 10-14 4 0.20 4 0.20 15-19 8 0.40 12 0.60 20-24 5 0.25 17 0.85 25-29 2 0.10 19 0.95 30-34 1 0.05 20 1 Total 20 1 S.M.Rasinger. 2013. Quantitative Research in Linguistics. 2e. Bloomsbury.