Download
1 / 10
100 likes | 248 Vues
Indian Power-plant NO x Emissions from OMI and Inventories. David Streets and Zifeng Lu Argonne National Laboratory Argonne, IL 60439. AQAST-3 Meeting University of Wisconsin - Madison June 13-15, 2012.

E N D
Indian Power-plant NOx Emissions from OMI and Inventories David Streets and Zifeng Lu Argonne National Laboratory Argonne, IL 60439 AQAST-3 Meeting University of Wisconsin - Madison June 13-15, 2012
A new, multi-year, bottom-up inventory of NOx emissions from Indian power plants has been developed • A detailed, unit-level inventory has been developed for India’s power sector during 1996-2010 • All units with capacity larger than 20 MW (> 800 units) are included • Plant-wise fuel consumption Data source: Thermal Performance Review (1996-2010); CEA, Government of India • NOx emission factors (g/GJ) • NOx control assumptions • Coal-fired power plants: • S1: Default IPCC EF is applied to all units • S2: No unit with LNB • S3: Units with capacity > 300 MW with LNB • S4: Units with capacity > 100 MW with LNB • S5: Units built after 1996 are equipped with LNB • Other thermal power plants: • India has NOx emission standards for gas-, liquid-, and diesel-fired power plants a Zhao et al., 2008 b IPCC, 2006 c Estimated d Zhao et al., 2010
Increasing trend in Indian NOx power plant emissions From 1996 to 2010, Indian thermal power plants showed: Generating capacity: 84% increase Electricity generation: 110% increase Coal consumption: 95% increase NOx emissions: 71‒103% increase (S1-S5)
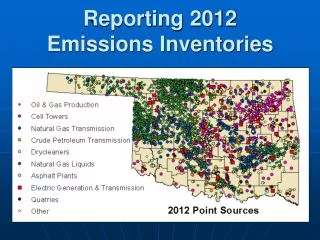
Indian power plants locations vs. NO2 columns Graphic shows the spatial distribution of monthly mean tropospheric NO2 from OMI during March 2005 – February 2011. Data source: KNMI, DOMINO ver. 2.0, Level 3
Seasonal response is highly variable Due to frequent cloud cover and heavy monsoon rainfall, July to September is the worst period for India to observe NO2 from satellites, thus excluded from the analysis.
Interannual variation of “power-plant” NO2 columns • Indian power plants are aggregated to 81 areas • 0.625⁰ × 0.625⁰ for an area with a single plant • For area i, NO2 tropospheric column due to emissions from power plant is calculated by: [NO2]power, i = (Emipower, i÷ Emii)× [NO2]i • Emiiare total NOx emissions in area i • Area emissions are taken from EDGAR4.1 for 2005, and scaled to 1996-2010 based on the GAINS inventory
Satellite NO2 trends for power plants are in good agreement with bottom-up NOx inventory emission trends • We find that the ratio of ∆E/E to ∆TVCD/TVCD decreased to less than one around 2005−2008, implying that • increasing the same proportion of NOx emissions leads to a greater surface NO2 increase now than in the past (NOxpollution in India becomes more and more serious) • a transition of the overall NOx chemistry occurred over the power plant areas, which may cause significant impact on the atmospheric environment
Comparisons of NOx emissions vs. NO2 columns Scatter plots (top, middle) R2 vs. the fraction of power emissions in the grid cell (fpower)
Situation for India seems better than for China Similarity NOx emissions from power sector are high and are continuously increasing in both countries Differences • The latitude of India is lower than China. Therefore, in India, • temperature is higher; NO2 lifetime is shorter; observed NO2 columns are more closely correlated with NOx emissions • solar zenith angle is smaller, and thus the tropospheric NO2 retrievals are more reliable (the vertical profile sensitivity of the satellite measurement is a function of solar zenith angle at the time of satellite overpass) • seasonality is weaker. All-year data (except for monsoon) can be used, whereas only summer data are used for China • Area emissions are smaller in India than in China • Indian NO2 columns are distributed as individual hotspots which are good for quantitative analysis
Current status • Paper entitled, “Increase in NOx emissions from Indian thermal power plants during 1996-2010: unit-based inventories and multi-satellite observations,” has been submitted to Environmental Science & Technology. Reviews have been received and are OK. Revised paper to be submitted by June 19. • We intend to inter-compare our analyses for China and India and add in Southeast Asia (in collaboration with the NASA SEAC4RS mission). Implications for the U.S. to follow.