Download
1 / 34
340 likes | 553 Vues
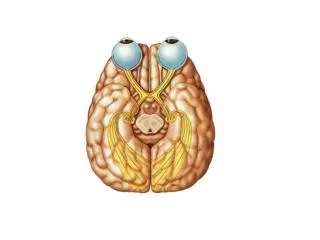
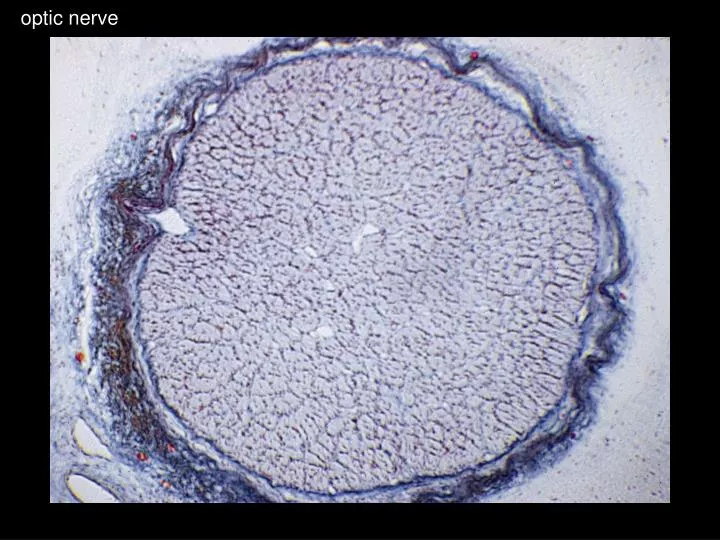
optic nerve. 1 deg. Striate Cortex (V1). Hubel & Wiesel. 1 deg. Striate Cortex (V1). Hubel & Wiesel. S 1. S 2. S 3. Spikes from an LGN Neuron: 62 Repeats of each stimulus. trial #. 1. 62. time. Firing Rate (Hz). Butts et al. 2010. -25 º. 0 º. +25 º. 80. 60. response

E N D
1 deg Striate Cortex (V1) Hubel & Wiesel
1 deg Striate Cortex (V1) Hubel & Wiesel
S1 S2 S3 Spikes from an LGN Neuron: 62 Repeats of each stimulus trial # 1 . . . . 62 time Firing Rate (Hz) Butts et al. 2010
-25º 0º +25º 80 60 response (spikes/s) 40 20 0 orientation Sclar & Freeman 1982
Odorant Receptors amines lactones acids sulfur terpenes aldehydes ketones aromatics alcohols esters Hallem & Carlson 2006
1 deg IT face cell Striate Cortex (V1) Tsao et al. 2006
x x x x x x x x x x x x + + + Striate Cortex LGN X = excitation = inhibition Hubel & Wiesel 1962
80% contrast 40% contrast 80 R1 0 -25º 0º +25º response (spikes/s) orientation Sclar & Freeman 1982
1.0 attend in attend out 0.5 0.0 -90º -60º -30º 0º 30º 60º 90º V4 response orientation McAdams & Maunsell 1999
adapting direction 100 spikes/s 50 0 0 180 -180 direction of motion Kohn & Movshon 2004
Late: >150 ms 140 spikes/s Early: 65 to 85 ms (2 or 3 spikes) 140 spikes/s = 45° = 90° = 135° Pack & Born 2001
sp/sec Spikes from an MT Neuron: Identical Stimulus, 210 Repeats trial # time (ms) Shadlen & Newsome 1994
Outline: neural coding lecture, pt 2 Population coding: a case study Problems in understanding decoding A cheat sheet for your homework assignment
Population coding: a case study the cricket wind direction sensing system (first-order neurons) Bacon & Murphey J. Physiol. 1984 352:601-623
Population coding: a case study the cricket wind direction sensing system (second-order neurons) First-order neuron projections to the terminal ganglion are organized according to preferred wind direction. There are four second-order neurons, and their dendrites are organized along the same divisions. Bacon & Murphey J. Physiol. 1984 352:601-623 see http://www.biol.sc.edu/~vogt/courses/neuro/neurolabs.html
cell 1 cell 2 cell 3 cell 4 r / rmax v wind direction (degrees) Population coding: a case study P. Dayan & L.F. Abbott Theoretical Neuroscience MIT Press
v Population coding: a case study P. Dayan & L.F. Abbott Theoretical Neuroscience MIT Press
Outline: neural coding lecture, pt 2 Population coding: a case study Problems in understanding decoding A cheat sheet for your homework assignment
Problems in understanding decoding Which spike trains are being decoded to produce a percept? Some criteria: Stimuli that produce different percepts should produce discernable changes in the spiking of the candidate neurons. Differences in the spiking of candidate neurons should be sufficiently reliable to account for the acuity of the percept. Noise in the activity of the candidate neurons should predict noise in the percept. Artificially stimulating the candidate neurons should affect the percept. Silencing or removing the candidate neurons should affect the percept. adapted from Parker & Newsome, Annu. Rev. Neurosci. 1998. 21:227–77.
Problems in understanding decoding Is information encoded in spike timing or spike rate? In principle, either spike timing or spike rate can carry information about a stimulus. adapted from Gollisch & Meister Science 2008 319:1108-11
Problems in understanding decoding How much of a spike train should we consider? Behavioral performance can help tell us what portion of a spike train we should consider. Cury & Uchida Neuron 2010 68:570-585
Problems in understanding decoding Is the optimal decoding algorithm always used by the organism? rapidly adapting slowly adapting psychophysical rapidly adapting type 2 rapidly adapting type 1 The “lower envelope model”: Sensory thresholds are specified by the neuron that has the lowest threshold for stimulus in question. Johansson & Vallbo, J. Physiol. 1979 297:405-422
Problems in understanding decoding Is the optimal decoding algorithm always used by the organism? rapidly adapting slowly adapting … but single neurons can exhibit better acuity than the organism as a whole! Johansson & Vallbo, J. Physiol. 1979 297:405-422
Problems in understanding decoding Does each neuron provide independent information to the decoder? The “pooling model”: Sensory thresholds can be improved by pooling independent information from many neurons.
Problems in understanding decoding Does each neuron provide independent information to the decoder?
Problems in understanding decoding Does each neuron provide independent information to the decoder? There is lots of evidence that activity in nearby neurons is often not independent.
Outline: neural coding lecture, pt 2 Population coding: a case study Problems in understanding decoding A cheat sheet for your homework assignment
Principal component analysis: a method for reducing the dimensionality of a data set by defining a reduced set of axes which account for much of the variance in the data. principal component 1 accounts for a large part of the variance (“body size”) principal component 2 accounts for a smaller part of the variance
Linear discriminant analysis: a method for classifying samples within a data set based on drawing a linear boundary (a line or plane) which best separates different categories of samples. discriminant