Download
1 / 1
10 likes | 116 Vues
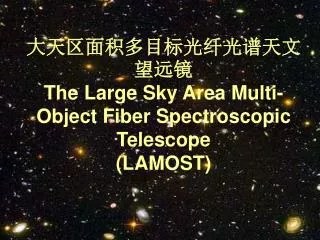
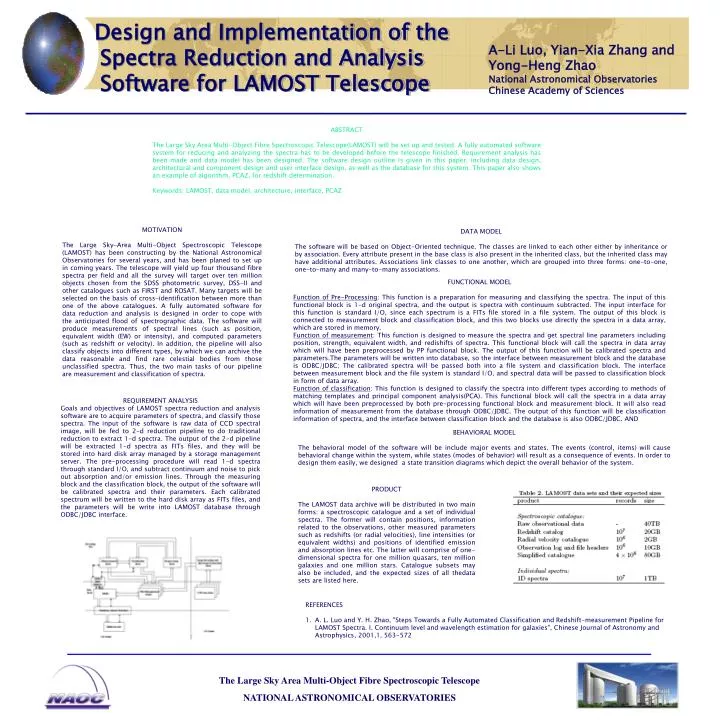
Design and Implementation of the Spectra Reduction and Analysis Software for LAMOST Telescope. A-Li Luo, Yian-Xia Zhang and Yong-Heng Zhao National Astronomical Observatories Chinese Academy of Sciences. ABSTRACT

E N D
Design and Implementation of the Spectra Reduction and Analysis Software for LAMOST Telescope • A-Li Luo, Yian-Xia Zhang and • Yong-Heng Zhao • National Astronomical Observatories • Chinese Academy of Sciences ABSTRACT The Large Sky Area Multi-Object Fibre Spectroscopic Telescope(LAMOST) will be set up and tested. A fully automated software system for reducing and analyzing the spectra has to be developed before the telescope finished. Requirement analysis has been made and data model has been designed. The software design outline is given in this paper, including data design, architectural and component design and user interface design, as well as the database for this system. This paper also shows an example of algorithm, PCAZ, for redshift determination. Keywords: LAMOST, data model, architecture, interface, PCAZ MOTIVATION The Large Sky-Area Multi-Object Spectroscopic Telescope (LAMOST) has been constructing by the National Astronomical Observatories for several years, and has been planed to set up in coming years. The telescope will yield up four thousand fibre spectra per field and all the survey will target over ten million objects chosen from the SDSS photometric survey, DSS-II and other catalogues such as FIRST and ROSAT. Many targets will be selected on the basis of cross-identification between more than one of the above catalogues. A fully automated software for data reduction and analysis is designed in order to cope with the anticipated flood of spectrographic data. The software will produce measurements of spectral lines (such as position, equivalent width (EW) or intensity), and computed parameters (such as redshift or velocity). In addition, the pipeline will also classify objects into different types, by which we can archive the data reasonable and find rare celestial bodies from those unclassified spectra. Thus, the two main tasks of our pipeline are measurement and classification of spectra. DATA MODEL The software will be based on Object-Oriented technique. The classes are linked to each other either by inheritance or by association. Every attribute present in the base class is also present in the inherited class, but the inherited class may have additional attributes. Associations link classes to one another, which are grouped into three forms: one-to-one, one-to-many and many-to-many associations. FUNCTIONAL MODEL Function of Pre-Processing: This function is a preparation for measuring and classifying the spectra. The input of this functional block is 1-d original spectra, and the output is spectra with continuum subtracted. The input interface for this function is standard I/O, since each spectrum is a FITs file stored in a file system. The output of this block is connected to measurement block and classification block, and this two blocks use directly the spectra in a data array, which are stored in memory. Function of measurement: This function is designed to measure the spectra and get spectral line parameters including position, strength, equivalent width, and redishifts of spectra. This functional block will call the spectra in data array which will have been preprocessed by PP functional block. The output of this function will be calibrated spectra and parameters.The parameters will be written into database, so the interface between measurement block and the database is ODBC/JDBC; The calibrated spectra will be passed both into a file system and classification block. The interface between measurement block and the file system is standard I/O, and spectral data will be passed to classification block in form of data array. Function of classification: This function is designed to classify the spectra into different types according to methods of matching templates and principal component analysis(PCA). This functional block will call the spectra in a data array which will have been preprocessed by both pre-processing functional block and measurement block. It will also read information of measurement from the database through ODBC/JDBC. The output of this function will be classification information of spectra, and the interface between classification block and the database is also ODBC/JDBC. AND REQUIREMENT ANALYSIS Goals and objectives of LAMOST spectra reduction and analysis software are to acquire parameters of spectra, and classify those spectra. The input of the software is raw data of CCD spectral image, will be fed to 2-d reduction pipeline to do traditional reduction to extract 1-d spectra. The output of the 2-d pipeline will be extracted 1-d spectra as FITs files, and they will be stored into hard disk array managed by a storage management server. The pre-processing procedure will read 1-d spectra through standard I/O, and subtract continuum and noise to pick out absorption and/or emission lines. Through the measuring block and the classification block, the output of the software will be calibrated spectra and their parameters. Each calibrated spectrum will be written to the hard disk array as FITs files, and the parameters will be write into LAMOST database through ODBC/JDBC interface. BEHAVIORAL MODEL The behavioral model of the software will be include major events and states. The events (control, items) will cause behavioral change within the system, while states (modes of behavior) will result as a consequence of events. In order to design them easily, we designed a state transition diagrams which depict the overall behavior of the system. PRODUCT The LAMOST data archive will be distributed in two main forms: a spectroscopic catalogue and a set of individual spectra. The former will contain positions, information related to the observations, other measured parameters such as redshifts (or radial velocities), line intensities (or equivalent widths) and positions of identified emission and absorption lines etc. The latter will comprise of one-dimensional spectra for one million quasars, ten million galaxies and one million stars. Catalogue subsets may also be included, and the expected sizes of all thedata sets are listed here. REFERENCES A. L. Luo and Y. H. Zhao, "Steps Towards a Fully Automated Classification and Redshift-measurement Pipeline for LAMOST Spectra. I. Continuum level and wavelength estimation for galaxies", Chinese Journal of Astronomy and Astrophysics, 2001,1, 563-572 The Large Sky Area Multi-Object Fibre Spectroscopic Telescope NATIONAL ASTRONOMICAL OBSERVATORIES