Download
1 / 3
30 likes | 164 Vues
Severe Weather-OT Comparisons. How often is severe weather REPORTED near any OT detection?. Results are not truly representative of severe weather detection capability because severe weather reports are strongly correlated with population density

E N D
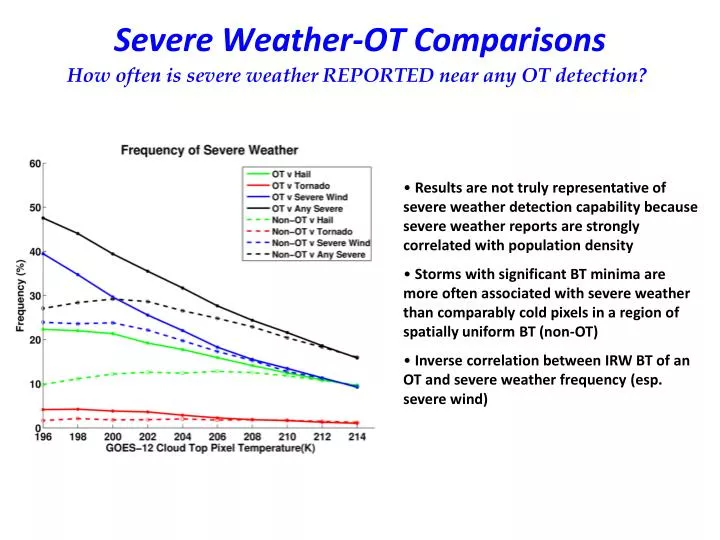
Severe Weather-OT Comparisons How often is severe weather REPORTED near any OT detection? • Results are not truly representative of severe weather detection capability because severe weather reports are strongly correlated with population density • Storms with significant BT minima are more often associated with severe weather than comparably cold pixels in a region of spatially uniform BT (non-OT) • Inverse correlation between IRW BT of an OT and severe weather frequency (esp. severe wind)
Analyzing The Co-Evolution of Satellite, Radar, and Total Lightning For An Individual Severe Convective Cell At 1-Minute Resolution • Total lightning flash detections from two different networks (NALMA and ENTLN) were monitored at 1-minute intervals within 15 km of the center of an individual OT-producing storm cell ~60 miles south of Huntsville, AL • OTs were detected by the GOES-R algorithm for 30 consecutive GOES scans, though an OT was evident in visible imagery prior to 2333 UTC • The height of the penetrating cloud top was inferred by the length of shadow cast upon the anvil by the OT + the 16.2 km equilibrium level height from the 00Z Birmingham, AL sounding • The maximum radar-derived Precipitation Echo Top and Vertically Integrated Liquid within the storm were identified from the Birmingham and Huntsville. AL radars Storm Track Storm Track
Analyzing The Co-Evolution of Satellite, Radar, and Total Lightning For An Individual Severe Convective Cell At 1-Minute Resolution • INTERPRETATION • Total lightning begins to increase at the time of rapid cloud top cooling. OT detections initiate as the OT region becomes significantly colder than the anvil cloud • The physical cloud top height reaches a peak prior to the IR BT minimum. Thin ice at cloud top can induce a shadow but continued vertical ice flux after the time of peak overshoot raises the effective radiating height and decreases IR temperature • Total lightning and VIL rapidly increase at the time of the severe wind report, followed by a rapid collapse • This indicates a descending echo core and downdraft • VIL is connected to subsequent downdraft and outflow at ground physically because of water loading and melting. VIL is also correlated and physically connected to lightning flash rate via the non-inductive charging mechanism (ice-ice charging, L. Carey (personal communication))