Download
1 / 8
80 likes | 189 Vues
Electricity and Natural Gas in a Carbon Constrained World. Comm. Donald L. Mason,Esq. PUCO. Electricity Flow Diagram. U.S. Energy Consumption by Fuel. Natural Gas Consumption Trillion cubic feet. 26.1. 26.3. 24.1. 24.0. 23.2. 23.4. 21.8. Transportation. Electric Power. Industrial.

E N D
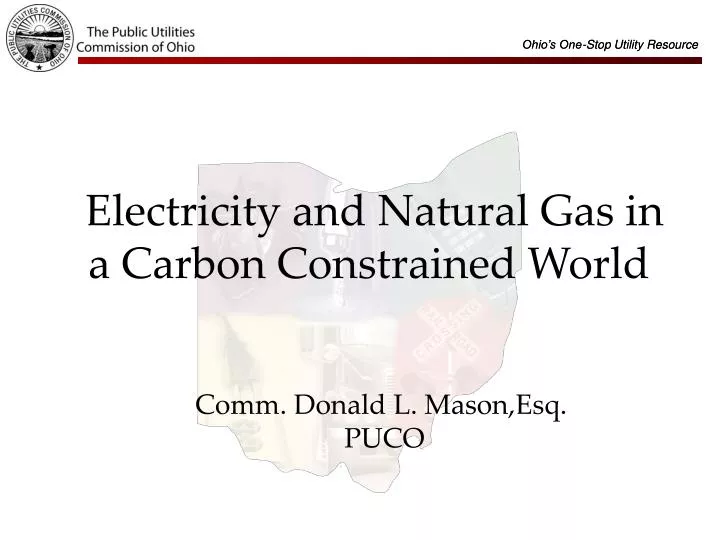
Electricity and Natural Gas in a Carbon Constrained World Comm. Donald L. Mason,Esq. PUCO
Natural Gas Consumption Trillion cubic feet 26.1 26.3 24.1 24.0 23.2 23.4 21.8 Transportation Electric Power Industrial Commercial Residential 2010 2030 2020
2006 dollars per mcf History Projection 5
U.S. Electricity Generation by Fuel, 1980-2030 (billion kilowatthours) History Projections Coal Natural Gas Nuclear Renewables Petroleum Annual Energy Outlook 2007
U.S. Natural Gas Consumption by Sector, 1990-2030 (trillion cubic feet) History Projections Industrial* Electric Power Residential Commercial Transportation** Annual Energy Outlook 2007 * Includes lease and plant fuel ** Includes pipeline fuel