Download
1 / 18
180 likes | 365 Vues
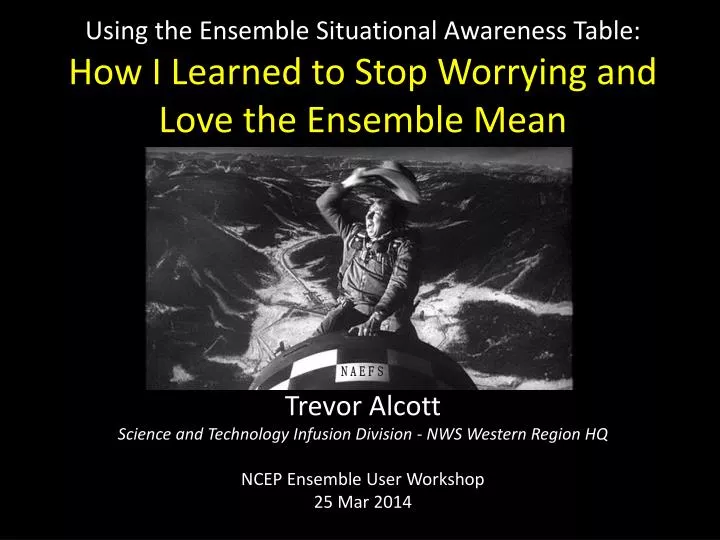
Using the Ensemble Situational Awareness Table: How I Learned to Stop Worrying and Love the Ensemble Mean. Trevor Alcott Science and Technology Infusion Division - NWS Western Region HQ NCEP Ensemble User Workshop 25 Mar 2014. NAEFS. Providing Tools for DSS.

E N D
Using the Ensemble Situational Awareness Table:How I Learned to Stop Worrying and Love the Ensemble Mean Trevor Alcott Science and Technology Infusion Division - NWS Western Region HQ NCEP Ensemble User Workshop 25 Mar 2014 NAEFS
Providing Tools for DSS • Using good science, our goal is to objectively answer these questions for the forecaster: • What is significant in the forecast? • How likely is it to happen? • What are the potential impacts?
Climatological Perspectives • “R-Climate”: reanalysis-climate • How does the model forecast compare to typical conditions at this time of year? • “You don’t usually get a trough this deep in September.” • “M-Climate”: model-climate • How does the model forecast compare to what is typically forecast at the same lead time, and this time of year? • “The model rarely predicts this much precipitation at a 5-day lead time.”
R-Climate Calculations • Goal: quickly identify where/when the forecast departs significantly from climatology. • NAEFS ensemble mean is compared to the 1979-2009 Climate Forecast System Reanalysis. • 1.0x1.0-degree NAEFS interpolated to 0.5 deg • Forecast is compared the CFSR for a 21-day window centered on the valid time. • 00Z compared only to 00Z analyses, 06Z to 06Z, etc.
User Interface http://ssd.wrh.noaa.gov/satable
500-hPa Height Integrated Water Vapor Transport Hour 120 Analysis
Better living through verification • How well can we anticipate significant events with a multi-model ensemble? • Focus on Zero and 100th-percentile events: • outside the climatological distribution for this time of year (3-week period centered on valid time, 30-year CFSR climatology) • Rarely all-time highs or lows, but usually significant enough to be associated with impacts. • Overall picture is low POD and low FAR, but let’s explore the details…
Coming Soon • More stable and publicly accessible website (please be patient) • Archived forecasts back to 1 Jan 2013 • Expanded set of verification graphics • Possibly a convective table
Questions/comments trevor.alcott@noaa.gov 801-524-5131